| Data Requirement | Description |
|---|---|
| Input Variables | Information on temperature, moisture, soil type, management practices (e.g., tillage, cover cropping, nutrient application), crop type, and other relevant factors. CSU's MaaS platform will provide all necessary modeling inputs, and users of the Fieldprint Platform will provide primary data for all field management practices. |
| Baseline Data | Baseline soil carbon measurements are crucial for establishing a starting point for sequestration calculations. Project owners are responsible for conducting soil sampling for the fields enrolled in their supply chain programs. In 2026, we anticipate that soil organic carbon sample data for individual fields can be entered into the SWAT+ model for more accurate estimation of soil organic stock changes. Project owners should be aware that soil sampling is typically a costly and time-consuming process that requires additional staff or 3rd-party support to process and manage the data. |
| Temporal Monitoring | SWAT+ can estimate changes in soil carbon over any period of time. However, project owners should consider that the GHG Protocol also recommends complementing the modeling effort with periodic field resampling, such as at 5-year intervals for those fields enrolled in supply chain programs. |
Soil Carbon
Methods 5.0
Models whether the soils in a field are losing, maintaining, or sequestering soil organic carbon.
Introduction: The Importance of Soil Carbon
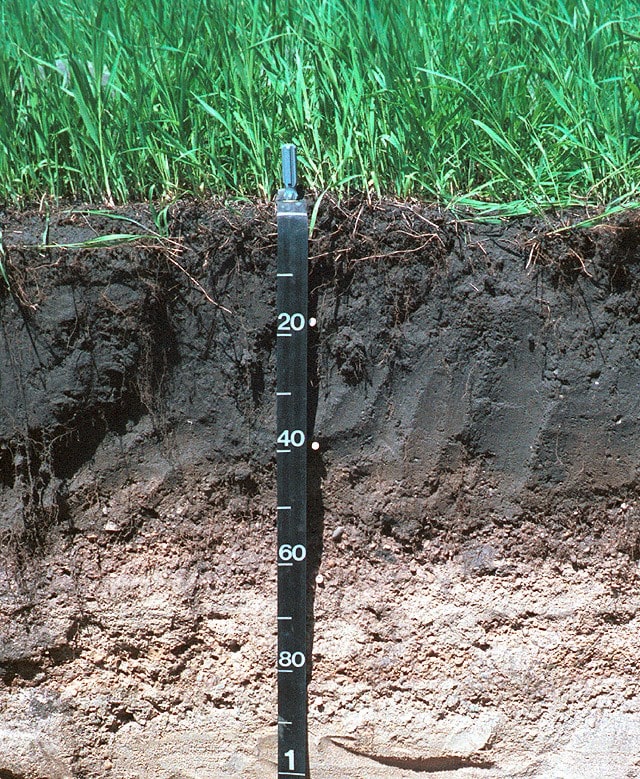
Agricultural soils in the United States represent both a significant challenge and a major opportunity in sustaining long-term food, fiber, and fuel production. Soils in North America have lost, on average, 20% to 75% of their original topsoil carbon in the upper 30 cm following historical conversion to agriculture (U.S. Global Change Research Program 2018). Globally, Sanderman et al. (2017) estimated that agricultural land uses have created a carbon debt of approximately 133 petagrams of carbon in the top two meters of soil, with losses accelerating over the past 200 years. The U.S. agricultural heartland, in particular, was identified in the study as a hotspot of soil organic carbon loss, driven primarily by intensive cropping and tillage practices that have depleted what was once some of the richest soil carbon stores on the continent.
Rebuilding soil carbon is critical for the productivity and resilience of American farmland. Soil organic carbon is an important sustainability indicator and a measure of soil health that supports many of the functions and ecosystem services vital to agricultural production (Field to Market 2021). Increasing carbon storage as soil organic matter helps mitigate climate change by removing CO₂ from the atmosphere, while also making agricultural systems more resistant to weather extremes (USDA Climate Hubs 2026). In practical terms, soils with higher organic carbon hold more water, resist erosion better, and support more robust nutrient cycling, all of which are important as U.S. farmers confront more frequent droughts and intense rainfall events.
The good news is that measurable progress is being made. According to a 2024 USDA analysis, mineral soils in the U.S. stored an estimated 62 million metric tons of CO₂ equivalent in 2022, a more than 58 percent increase since 1990, offsetting roughly 10 percent of all agricultural greenhouse gas emissions (U.S. Department of Agriculture 2024). The primary drivers behind these gains include reduced and no-till practices, expansion of cover crops, crop-pasture rotations, manure amendments, and land set aside under USDA’s Conservation Reserve Program (U.S. Department of Agriculture 2024). Continued investment in these conservation practices, supported by technical assistance from NRCS and state soil health programs, is essential to sustaining and accelerating this positive trend. As Field to Market and other organizations have documented, tracking soil carbon change at the field scale through tools like the Fieldprint Platform helps ensure that these efforts are grounded in science and measurable outcomes (Field to Market 2021).
Overview of the Soil Carbon Model
One of the most notable enhancements of Fieldprint Platform Version 5 is the implementation of SWAT+ (Soil and Water Assessment Tool Plus), a process-based model, to estimate soil carbon stock changes. During the years 2012-2022, Field to Market attempted several times to replace the model of choice for the Soil Carbon indicator with a quantitative model. The challenges we faced were many:
Finding a like-minded research group to collaborate with for model integration and maintenance who also understands Field to Market member perspectives.
The high requirements for data collection.
The licensing and cost barriers for some models that simulate soil carbon dynamics.
In 2023, researchers at the One Water Solutions Institute, which operates under Colorado State University’s Department of Civil and Environmental Engineering, informed Field to Market of their plans to integrate SWAT+ to their suite of modeling services. The One Water Solutions Institute has been providing Field to Market with modeling services since 2012, starting with the Soil Conservation and Water Quality indicators. The addition of SWAT+ for soil carbon modeling was a natural progression for CSU, as they had already integrated the DayCent model for soil carbon dynamics for other projects.
Field to Market’s Metrics Committee voted affirmatively to replace the Soil Conditioning Index (USDA 2003) with SWAT+ in January 2024. The collaboration with CSU met the criteria that would benefit Field to Market members the most, including:
Process-based model that estimates quantitative outcomes.
Open-source.
Large and active base of users and developers.
Well-researched.
Accessible and like-minded group of collaborators to develop and maintain the model.
Licensing framework that allows Field to Market to pass modeling results to data partners, regardless of commercial, educational, or research usage.
A significant value of SWAT+ is that it is transparent and open-source, and it can be reproduced in its entirety by professionals with modeling skills. Through a collaboration of CSU, USDA ARS, and Texas A&M University, a formal version control system has been established to bring SWAT+ to the worldwide community of developers (Arnold et al. 2024), which enables model improvements to be incorporated into the main code base in a collaborative approach (David et al. 2024).
Important
The Soil Carbon indicator and the source Soil Carbon Stock Changes included in the GHG Emissions indicator consist of the same output: annualized soil carbon fluxes modeled by SWAT+.
Introduction
The advent of conservation agriculture initiatives has driven demand for models and tools to quantify GHG emissions from croplands. The functions from SWAT-C (Zhang et al. 2013) have been incorporated into SWAT+ to support agricultural field-scale simulations and lay a foundation for further development.
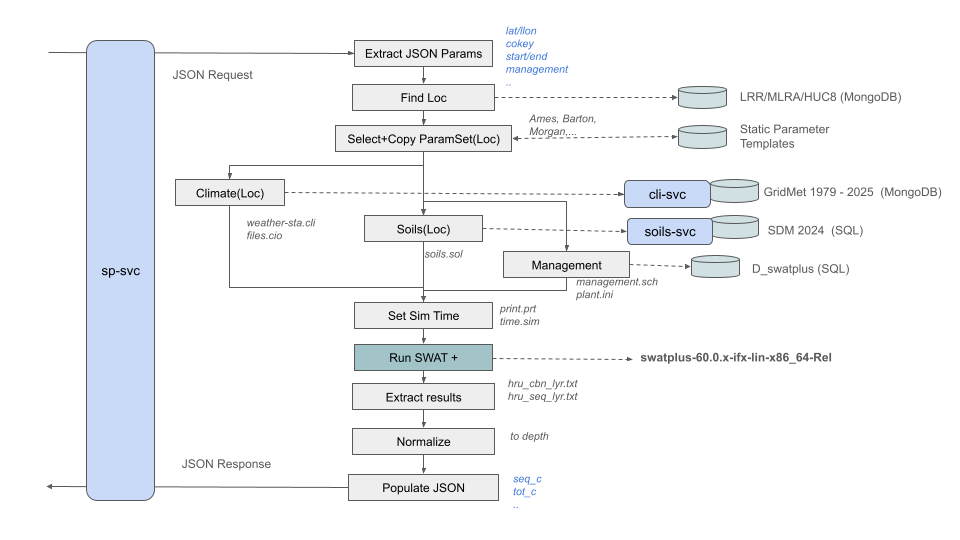
Field to Market integrated SWAT+ in the Fieldprint Platform as the model of choice for estimating the Soil Carbon indicator and the Soil Carbon Stock Changes source in the GHG Emissions indicator. The development teams from USDA ARS, Texas A&M Blackland Research and Extension Center (BREC), Colorado State University, and Field to Market have been extensively testing SWAT+ performance, which was adapted and designed to run for one or multiple hydrologic response units (HRUs).
The team at CSU has built the Cloud Services Integration Platform (CSIP) (David et al. 2014) to run soil organic carbon (SOC) quantification. The CSIP service provisions climate, soils, and management data, runs the model at a computational scale, and post-processes results into the Fieldprint Platform. The Fieldprint Platform provides the output to users as part of a suite of eight sustainability indicators.
SWAT+ model history
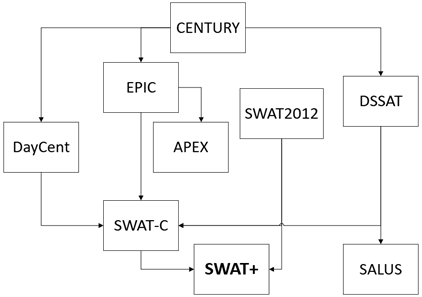
SWAT+ is a restructured version of the Soil & Water Assessment Tool (SWAT), allowing for more flexible spatial interactions and processes within a watershed than the previous model version (Bieger et al. 2017). SWAT+ is a public domain model jointly developed by USDA ARS and Texas A&M at Blackland Research and Extension Center, under an LGPL-2.1 license (Free Software Foundation 1999).
Figure 1 shows a simplified view of the model’s pedigree. SWAT+ inherited the stable SWAT2012 model, and obtained the soil organic carbon code from SWAT-C (Zhang et al. 2013), which in turn originated from code from the CENTURY and EPIC models.
Workflow
SWAT+ estimates soil organic carbon dynamics from 2008 to the latest available year, and assess the trend resulting from management and conservation practices. The Fieldprint Platform sends a modeling request containing field-specific data to the SWAT+ model web service (Figure 2), which processes the request by translating the management inputs, adding location-specific weather, soil parameters, and other required data inputs required for SWAT+ to run. The service runs one simulation for each soil type, returning the modeling results to the Fieldprint Platform to present the post-processed output to users. Fieldprint Platform inputs to the SWAT+ model service match reasonably well with inputs to the USDA Water Erosion Prediction Project (WEPP) (Flanagan et al. 2024) and the Wind Erosion Prediction System (WEPS) (Wagner 2013) models, which are used by the Fieldprint Platform for the Soil Conservation indicator.
The USDA Conservation Effect Assessment Project (CEAP), authorized in the Farm Bill since 2002, runs SWAT+ to model water quality and other resource effects on 2,000+ HUC-8 watersheds across the country to assess the impact of conservation practices on agriculture and the broader environment (Mausbach and Dedrick 2004; Duriancik et al. 2008). The CEAP work produces soft-calibrated input parameter datasets for crop biomass and water balance specific to each HUC-8. The Fieldprint Platform SWAT+ model service leverages these input parameters to realistically simulate the farmer’s cropping system. As necessary, additional hard calibrations will adjust carbon and nitrogen flux parameters to achieve sample and research study soil organic carbon targets by region and soil strata.
Important
What are soft and hard data for model calibration?
A rich conceptual discussion of soft and hard calibration data for environmental modeling can be found in Seibert and McDonnell (2002). Specific to the SWAT+ ecosystem, soft and hard calibration strategies have been employed by several researchers (Čerkasova et al. 2023; Yen et al. 2016; Chawanda et al. 2020).
Čerkasova et al. (2023) defines the terms as follows:
Soft data are defined as information on individual processes within a budget [system] that may not be directly measured within the study area.
Hard data are more rigorous, representing observational data directly comparable with some element in the model.
Arnold et al. (2015) includes examples of soft data, such as average depth of groundwater table, average crop/vegetation leaf area index, annual rates of denitrification from the literature, or county-level crop yields from USDA NASS. Hard calibration data include measurements of streamflow, groundwater levels, or soil moisture for a given area.
The SWAT+ model service quantifies soil carbon stock to a specified depth in the soil profile, the default set to 30 cm. The model simulates soil carbon stocks, fluxes among carbon and nitrogen pools, and CO2 emissions by soil horizon, as well as carbon and nitrogen loss through runoff, lateral flow, and percolation through the soil profile.
Agroecosystem models such as SWAT+ generally lack sufficient measured SOC time series data coverage (hard data) for comprehensive regional calibration. However, exclusive reliance on hard data can lead to misrepresenting underlying processes as calibration targets are met. Calibrating parameters to underlying process targets (water balance, biomass/yield, nutrient balance, etc.) using soft data (expert knowledge, soil samples, crop survey data, etc.) enables more realistic simulations. SWAT+ model calibration uses a combination of soft and hard data according to the NRCS Land Resource Region (LRR), to the major land resource area (MLRA), or to HUC-8 watershed, depending on data availability. Model validation uses the measured data sets from long-term studies across the country supporting other validation efforts for ecosystem service crediting and delivery.
Prior to calling the SWAT+ model service, Fieldprint Platform uses the Cropland Data Layer to fill in a yearly cash crop sequence for a given field boundary, adding typical or user-specified plant, harvest, fertilization, tillage, and other management activities to an input object for the model service. The process of creating the management object assumes that high-quality user-specified inputs override typical pre-filled inputs. Based on the Fieldprint Platform request, which provides field location, the SWAT+ model service resolves valid soil components in the field from the NRCS Soil Data Mart (SDM), adding soil component identifiers in the service request. The Fieldprint Platform request may specify a practice change year to separate a baseline period and facilitate a before/after analysis.
Upon receipt of the web service request from the Fieldprint Platform, the SWAT+ model service conducts data quality checks to verify readiness for model simulation. The service intersects location coordinates with gridMET weather data (Abatzoglou 2013) to create an input file containing daily values for precipitation, temperature, solar radiation, relative humidity, and wind speed from 2008 through the most recent year.
The service creates input files for each soil component specified in the request, including bulk density, water holding capacity, soil texture, pH, organic matter, percolation, and other required parameters. The service processes the management object to files and formats needed for the model. It updates other model input files on the fly, reflecting field conditions. Finally, the service feeds the inputs to the SWAT+ model, running simulations for each valid soil component in the field.
For each simulation, SWAT+ initializes structural and metabolic litter pools, microbial (active), slow (resistant), and passive (mineral adsorbed) soil organic carbon (SOC) pools using the SDM organic matter parameter (or on-site sampled SOC data) and ratios derived from CENTURY model research. The model stabilizes output through a seven-year warm-up simulation period (2008 to 2014). The model grows each crop specified in the management object, allocating biomass to crop yield, leaving the field, above-ground, and root residue, and then partitioning residue to structural and metabolic litter above and below ground. The model simulates the carbon and nitrogen (C + N) dynamics from the litter pools to the microbial and slow SOC pools, with microbes in the microbial pool fluxing C + N to and among decomposition-resistant slow and very resistant passive SOC pools. Each step respires CO2 while also losing C + N to solution in runoff, percolation, and lateral flow. SWAT+ quantifies daily litter and SOC for each pool on the soil surface and on all soil profile horizons. Sequestered carbon is considered the sum of microbial, slow, and passive SOC below the soil surface.
Once a simulation is complete, the SWAT+ model web service post-processes the output to a response payload back to the Fieldprint Platform, containing SOC stock results from 2008 onward at specified soil depths, along with other outputs needed to populate the Soil Carbon indicator reports. The standard reporting depth is 30 cm; however, SWAT+ has the ability to produce output for several depth options, as needed by users. The service also produces a time-limited simulation archive for technical support and problem diagnosis. Future service enhancements will include options to project SOC trends ten or more years into the future and compare SOC trends to a baseline.
For Fieldprint Platform Version 5, the Energy Use, GHG Emissions, and Soil Carbon indicators provide results for the assessment of various management practices intended to reduce energy use and GHG emissions, and increase SOC stocks:
Reducing the number and intensity of tillage activities.
Increasing sources of carbon through cover cropping.
Growing perennial crops or implementing perennial conservation cover.
Impact of residue management.
Organic matter additions (animal manure, green manure).
Although tillage can incorporate large amounts of surface residue into the soil, it exposes sequestered carbon and root litter to increased microbial decomposition. This leads to higher CO2 emissions, usually to the point of net SOC losses with high disturbance tillage. On the other hand, reduced and no-till management might lead to net gains on some soils and regions. Introducing deep-rooted perennials (e.g., alfalfa) to the cropping sequence adds residue and increases SOC in lower soil layers. Increasing cropping intensity with cover crops puts more live roots in the ground during the year, resulting in higher root residue litter pools and a higher likelihood of increasing SOC.
Crop growth module
SWAT+ can simulate crop growth for one-at-a-time and simultaneous crops within a given field (Bieger et al. 2017). The module uses schedule files with activities, dates, heat units, and decision tables, which are more flexible than the APEX and EPIC models (Arnold et al. 2018). The crop growth module is flexible enough to allow for inter-cropping of cash crops and cover crops. The plant growth database distributed with SWAT+ includes parameters for the most common plant species (row crops, vegetables, trees, and grasses).
SWAT+ uses the date input in the management operation file to simulate the crop growth cycle. Scheduling by heat units allows the model to time the operation as a function of temperature. Using heat units allows the management operation to be used anywhere in the watershed, and depending on the weather in each region or the changing weather from year to year, the model adjusts the timing of the cycle each year.
The details of SWAT parameters for the crop growth module and all other components are available online at SWAT Development Team (2026).
Soil organic carbon module
The SWAT+ soil organic carbon module was based on the SWAT-C model (Zhang et al. 2013). SWAT-C was developed based on SWAT2012 version 682. SWAT-C incorporated terrestrial soil organic matter dynamics from the CENTURY and EPIC models and aquatic carbon cycling processes from QUAL2K and CE-QUAL-W2 (Du et al. 2019) into SWAT2012, enabling the assessment of carbon and nitrogen fluxes on cultivated land through water courses and wetlands in a watershed. New algorithms have been added to enable the model to represent the coupled terrestrial and aquatic carbon cycle at the watershed scale. SWAT-C calculated SOC based on the combined factors Izaurralde et al. (2006) modified to represent biochemical and hydroclimatic processes influencing the carbon cycle and balance in an agroecosystem.
In SWAT+, the distribution of C and N across soil layers (Figure 3) is divided into five pools (organic and inorganic) as in the CENTURY model, with the turnover time included:
Metabolic litter (<1 year): The readily decomposable organic matter from plants, such as dead organic matter or leaves with high nitrogen content and animal waste.
Structural litter (1 year): It refers to the more resistant, slowly decomposing organic material, like lignin.
Microbial biomass (<1 year): The living mass of microorganisms such as bacteria, fungi, protozoa, and nematodes within the soil, responsible for breaking down organic matter like litter into simpler compounds.
Slow humus (5 years): Slow humus is partially decomposed organic matter that breaks down moderately over several years.
Passive humus (200+ years): Passive humus is a highly stable, old organic matter that decomposes over centuries.
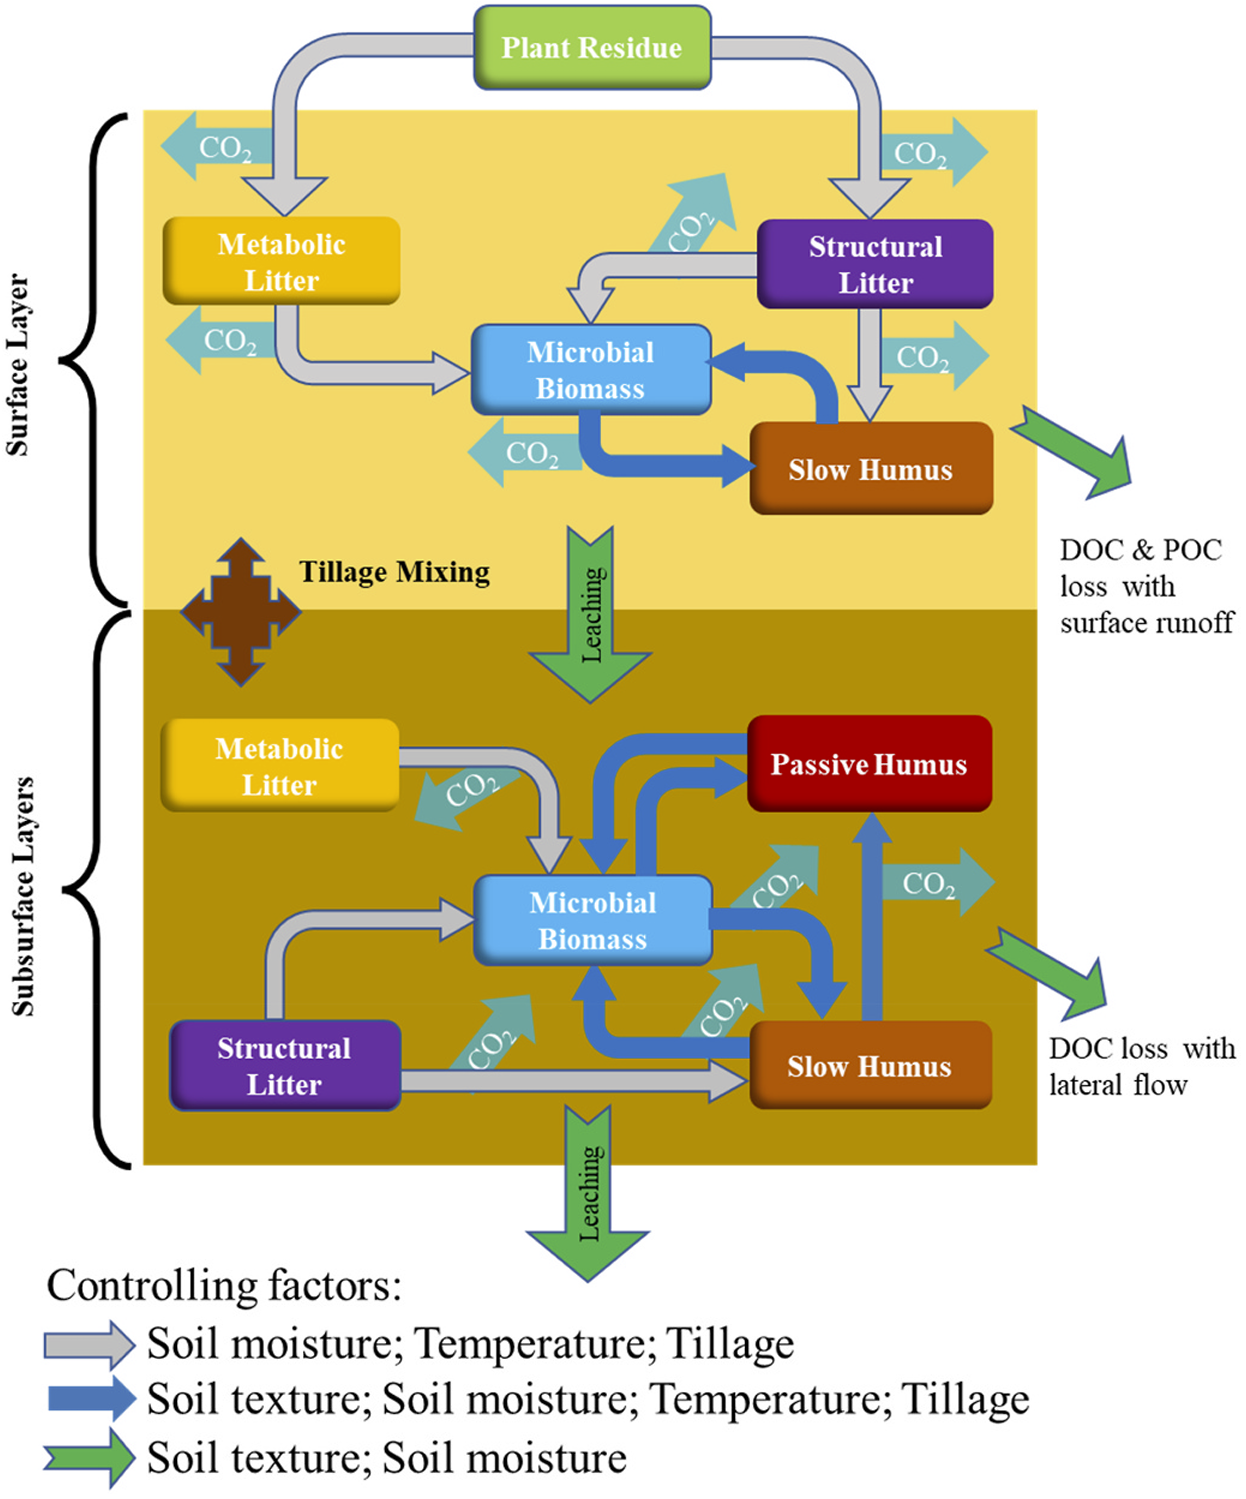
Soil organic carbon turnover rates depend on nonlinear processes influenced by environmental and management factors (Liang et al. 2022). Carbon and nitrogen flow among these pools through various pathways influenced by biotic and abiotic factors (Figure 3). The decomposition and transformation rates of C and N among these pools are affected by soil temperature, soil water content, soil texture, land management practices, soil aeration, and conditions such as the soil C/N ratio. Carbon flow within the soil profile is associated with hydrologic processes such as percolation, lateral flow, and soil erosion. Tillage and percolation can redistribute SOC vertically, while lateral flow and erosion redistribute SOC laterally. Figure 3 illustrates the addition, decomposition, and transformation of SOC among the different pools and its flow in various soil layers represented in SWAT-C.
Model setup
As explained in Section 2.1, the development team at CSU has added SWAT+ to their Cloud Services Integration Platform (CSIP) (David et al. 2014) to run soil organic carbon simulations. The CSIP service appends climate, soils, and management data for a given field, runs the model at a computational scale, and post-processes results for the Fieldprint Platform. The same version of the SWAT+ model implemented by CSU via CSIP can be found in a GitHub repository (Arnold et al. 2024).
Data inputs
Data and resources developed by the National Agroecosystem Model (NAM), a comprehensive model that uses SWAT+ to simulate crop yields across the contiguous United States (Čerkasova et al. 2023).
CRLMOD reference data (Kucera and Coreil 2023).
Soil Survey Geographic Database (Soil Survey Staff, n.d.).
Land use map, digital elevation model, watershed outlets, reservoirs, and soil map to delineate watersheds and define Hydrological Response Units (HRUs) and Landscape Units.
Climate data such as daily precipitation, minimum and maximum temperature, solar radiation, relative humidity, and wind speed (Abatzoglou 2013).
Cropland Data Layer for detection of cash crops and land use (Boryan et al. 2011).
Primary crop management data from farmers.
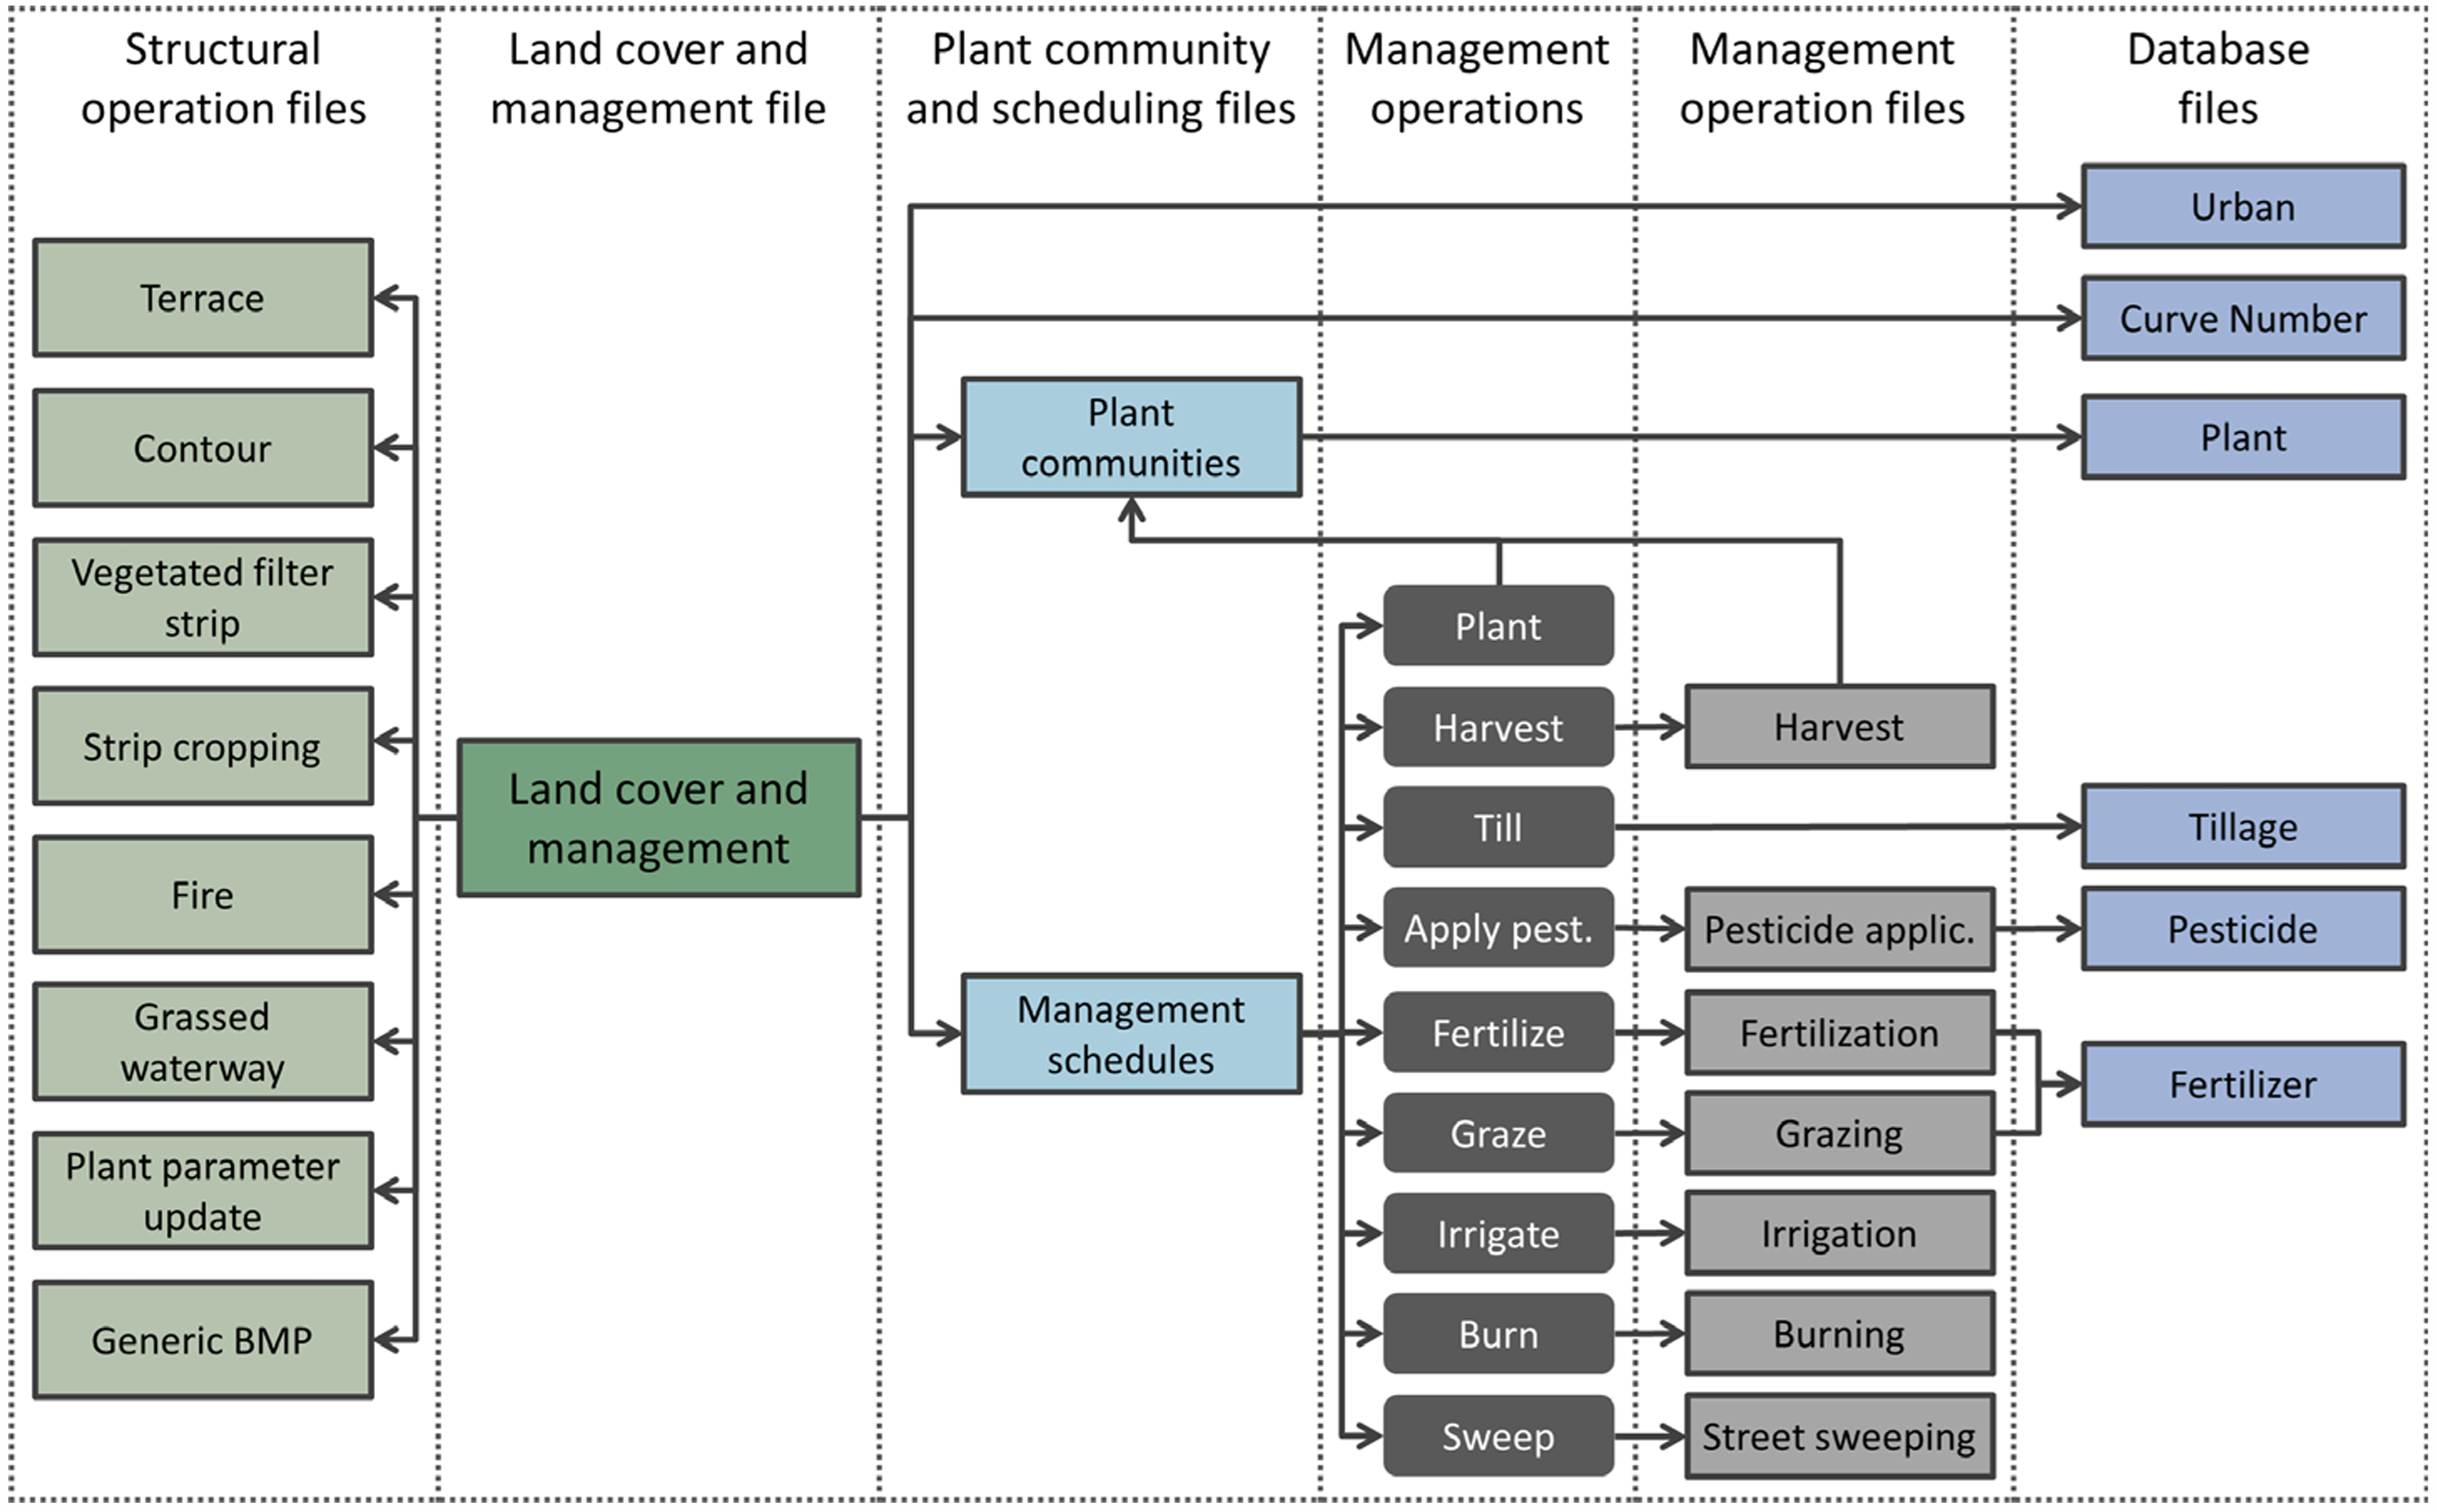
Figure 4 shows the management files that can go into SWAT+. The implementation of the Fieldprint Platform uses select modules.
Definition
With the implementation of SWAT+, annual soil organic carbon fluxes can be expressed either as elemental carbon or carbon dioxide equivalents as follows:
\[ \Delta SOC = \Delta SOC_{microbial} + \Delta SOC_{slow} + \Delta SOC_{passive} \] Where:
- \(\Delta SOC\) = Soil organic carbon (SOC) stock changes from consecutive years.
- \(\Delta SOC_{microbial}\) = SOC stock changes from the mass of microorganisms within the soil.
- \(\Delta SOC_{slow}\) = SOC stock changes from partially decomposed organic matter that breaks down over several years.
- \(\Delta SOC_{passive}\) = SOC stock changes from passive humus that decomposes over centuries.
Modeling approach
The modeling approach from Colorado State University for SWAT+ follows the principles from Del Grosso et al. (2011) to test and review model performance:
Conduct an initial model run using best estimates of weather, soil, and plant parameters.
Are plant growth, soil carbon, and grain yields reasonable?
- If not, refer back to initial input parameters to ensure they are correct (e.g., maximum and minimum temperatures, precipitation, crop type, soil profile characteristics).
Are soil water content and soil N correct?
- If not, adjust soil hydraulic properties (e.g., Ksat, percent sand, percent clay, and bulk density.
Are ET [evapotranspiration], leaching rates, and runoff correct?
- If not, adjust any number of water conductance parameters.
- These include but are not limited to: \(K_{sat}\), permanent wilting point, field capacity, rooting depth, infiltration rates, stomatal conductance, etc.
- If not, adjust any number of water conductance parameters.
Are fertilizer applications and cultivation methods correct?
- The model is very sensitive to fertilizer additions. Slight variations can cause major differences in plant production, so ensure appropriate conversions have been made, if necessary.
Are site parameters accurate?
- If not, refer to site input file and validate climate, soils, and water information.
Are trace gas emissions reasonable?
- If not, refer to the amount of N availability in soil, plant N demand, and soil water information.
Are plant growth, soil carbon, and grain estimates still correct?
- If not, recalibrate parameters related to plant production and soil processes.
Future SWAT+ developments
The SWAT-C N2O component could be integrated into SWAT+, enabling the Fieldprint Platform to use a Tier 3 approach to estimate N2O emissions as part of the GHG Emissions indicator.
Researchers are developing a SWAT+ module to simulate CH4 emissions from flooded rice production. Eventually, this module could replace the Tier 2 method for CH4 emission estimations from rice production. See Section 2.13 for additional context.
SWAT+ could support the Water Quality indicator by providing quantitative estimates of nitrogen and phosphorus losses.
Uncertainty quantification
Important
The development of uncertainty quantification for soil carbon stock estimates is in progress since mid-2025.
We plan to start providing uncertainty bounds for Fieldprint Projects starting in fall 2026.
Since mid-2025, SWAT+ developers have been actively applying computational frameworks to analyze the uncertainty in model estimates of soil carbon stocks, with the goal of developing uncertainty bounds around field-level estimates. The uncertainty sources in models such as SWAT+ are several, including model parameters, input data, model structure, and measurement data used for training and testing the model (Tasdighi, Arabi, Harmel, and Line 2018).
Developers are using approaches that have been applied to SWAT2012, the previous model version before SWAT+, to produce uncertainty bounds (Tasdighi, Arabi, Harmel, and Line 2018; Arabi et al. 2007; Tasdighi, Arabi, and Harmel 2018; Arnold et al. 2012). To quantify the uncertainty inherent in SWAT+ model estimates of soil organic carbon and other environmental outcomes, the CSU modeling team is implementing the Dakota framework, an open-source software toolkit developed by Sandia National Laboratories for optimization and uncertainty quantification (Adams et al. 2014). Dakota provides a flexible interface between simulation codes and a suite of iterative analysis methods, including Monte Carlo and Latin Hypercube sampling, sensitivity analysis, and Bayesian calibration, enabling the systematic forward propagation of input parameter uncertainties through computational models to generate statistical assessments of output variability. By coupling SWAT+ with Dakota’s sampling-based uncertainty quantification capabilities, the CSU team is characterizing how uncertainties in model parameters, such as soil properties, climate inputs, and management assumptions, translate into confidence bounds on SOC estimates, providing users with not only point estimates but also credible intervals that reflect the range of plausible outcomes.
Uncertainty bounds, also known as prediction intervals, are one tool in the uncertainty quantification toolbox. Generally, sources of uncertainty include:
Input data uncertainty: Errors and variability in the data used to drive the model (e.g., climate data, soil properties).
Parameter uncertainty: The imprecision in the estimated values of model parameters, often due to limited or noisy calibration data.
Model structure uncertainty: The errors and biases that arise because the mathematical equations used may be an imperfect representation of the real-world processes.
Residual error and stochasticity: The inherent randomness in the natural system that the model cannot explain.
General considerations of agroecosystem models
Del Grosso et al. (2011) provide a useful summary of considerations:
No perfect method exists to measure variables of interest in agroecosystems.
There are limitations when ground-based measurements at small spatial and temporal scales are used to infer variables at larger scales.
Models can provide complete spatial and temporal coverage; however, models are a simplification of reality.
There is uncertainty in both the inputs used to run models and the measurements to test model outputs.
Some model inputs have less uncertainty than others (e.g., grain yield vs gas fluxes).
Model results are nearly always mixed; some outputs compare well against measurements in some conditions, but not all.
Initial assessment of SWAT+ alignment with GHG Protocol LSRG
Important
A third-party professional assessment about the Fieldprint Platform’s alignment with the GHG Protocol’s recently-published LSRS is being developed and will be ready by Q2 2026.
Many stakeholders and members have asked whether SWAT+ outputs are approved by the GHG Protocol to claim soil carbon removals. The GHG Protocol does not have a mechanism to formally approve tools or models in the sense of a certification, recognition, or endorsement program. The Built on GHG Protocol recognition was officially shut down on August 13, 2024 (Greenhouse Gas Protocol 2024). However, guidance from the GHG Protocol LSRG, released in 2022, played a significant role in the development of Fieldprint Platform Version 5.
The GHG Protocol’s Land Sector and Removals Standard (LSRS) was published in January 2026 to provide a robust framework for companies to account for and report greenhouse gas emissions and removals related to land use, land use change, and carbon removal technologies. This includes requirements for soil carbon sequestration models.
Below is a summary of what was expected for soil carbon sequestration models under the GHG Protocol LSRG (published in 2022):
Consistency and Transparency: The guidance aimed to create more consistent and transparent methods for quantifying and reporting GHG emissions and removals from land.
Accuracy: Companies are expected to use robust methods to ensure the accuracy of their reported soil carbon changes. This includes addressing uncertainty.
Completeness: All relevant carbon pools and fluxes should be accounted for within the defined boundary. For agricultural soils, this primarily means soil organic carbon.
Comparability: The guidance promoted comparability across different companies and over time.
Credibility: The methods used should be credible and aligned with established scientific principles, such as IPCC guidelines.
The LSRG allowed Tier 3 models for estimating CO2 emissions or removals from increases in soil carbon stocks, particularly when significant impacts are expected. For model-based approaches to estimate soil carbon stock changes, such as the implementation of SWAT+ into the Fieldprint Platform, the draft guidance provides the following considerations:
Conformity with IPCC Guidance: Models should conform to the guidance provided by the Intergovernmental Panel on Climate Change (IPCC) for Tier 3 methodologies. This means they should be based on sound scientific principles and consider relevant factors that impact soil carbon dynamics, such as climate, soil types, crops being grown, nutrient application, and management practices.
Mathematical Representation of Biogeochemical Processes: Process-based models are preferred as they mathematically represent the complex biogeochemical processes characterizing agroecosystem functions, including GHG emissions and carbon sequestration. The algorithms in SWAT+ that model soil carbon dynamics have undergone peer review and been published (Zhang et al. 2013).
Data Requirements: Process-based models often require detailed data for parameterization and calibration. This includes:
Uncertainty Management: Companies are expected to estimate and manage uncertainty in their data, methods, and models. This includes providing evidence that model estimates do not deviate significantly from defined uncertainty ranges. SWAT+’s validation and uncertainty quantification is in progress, starting with cropping systems in the U.S. Corn Belt.
Applicability and Suitability: The chosen model should be appropriate for the specific land use system, climate, and management practices being evaluated. SWAT+, as implemented via the Fieldprint Platform, has been adapted to represent U.S. conditions, incorporating regional parameters to provide a more accurate representation of climatic conditions, soil types, and water availability, among other variables.
Transparency and Documentation: The methodology, input data, assumptions, and results of the model should be transparently documented to allow for review and verification. SWAT+ is open source, transparent, and reproducible. The entire code base is already available via a GitHub repository (Arnold et al. 2024).
Alignment with Corporate Standards: Any soil carbon sequestration reported through modeling must align with the overall corporate GHG inventory, including adherence to the GHG Protocol Corporate Standard and Scope 3 Standard where applicable. Field to Market reports on soil carbon emissions or sequestrations as part of the GHG Emissions indicator. Project owners are responsible for using the data in accordance with the GHG Protocol for their supply chain programs.
Distinguishing Removals from Storage: The LSRG guidance differentiates between carbon removals (fluxes from the atmosphere) and carbon storage (in pools/reservoirs), and models should be able to track both appropriately. SWAT+ will model field-level crop rotations and management practices provided by users of the Fieldprint Platform. Carbon removals will result from SWAT+ estimating increases in soil carbon stocks in biogenic sinks.
Reporting of Emissions and Removals: The models should support the separate reporting of emissions and removals. The SWAT+ model reports annual changes in soil carbon stocks resulting from crop management practices, indicating whether these practices lead to emissions or soil carbon sequestration for a given calendar year.
In summary, the LSRG emphasized the use of scientifically sound and data-driven approaches for quantifying soil carbon sequestration and suggested using robust modeling techniques that can accurately reflect changes over time and under various management scenarios.
Project owners should be aware that the draft guidance required initial soil sampling and resampling at least every five years to verify modeled results to report land management net CO2 removals. The draft guidance appeared to permit representative sampling of lands and carbon pools, rather than requiring the sampling of every field enrolled in a supply chain program.
Field to Market will continue to collaborate with model developers and members to ensure that the modeling outputs from SWAT+ align with the GHG Protocol Land Sector and Removals Standard.
Known limitations and potential enhancements for SWAT+
Important note for flooded rice production systems: SWAT+ does not currently account for the unique, complete hydrologic dynamics of paddy rice systems, including standing water management and modified percolation regimes, which significantly influence soil organic carbon cycling. SOC estimates for fields with rice in their cropping history should be interpreted with caution and may warrant exclusion from GHG emission inventories pending further model evaluation. Fortunately, recent advances in simulating paddy hydrology and irrigation management within SWAT+ (Jeong et al. 2025) suggest that robust modeling of SOC fluxes in rice production systems may be achievable in future model iterations.
We are currently assessing how to use soil samples to refine SWAT+ modeling runs. We plan to release recommendations at a later date in 2026.
Model Inputs
The Fieldprint Calculator connects via API to servers that run the SWAT+ model. Understanding these data requirements helps users appreciate what information influences the model results and how their input choices affect soil carbon estimates.
User-derived inputs
| Input Category | Specific Inputs | Description |
|---|---|---|
| Field Location | Latitude and longitude | Precise coordinates identifying the field location |
| Field Characteristics | Length | Slope length dimension in meters |
| Width | Slope width dimension in meters | |
| Slope steepness | Percent slope or grade of the field | |
| Slope type | Characterization of slope (e.g., “Uniform”) | |
| Aspect | Field orientation in degrees relative to north | |
| Soil Information | Soil identifier | Reference to specific soil data from SSURGO soil databases for texture, organic matter, erodibility factors |
| Management Rotation | Rotation name or custom rotation | Identifier for the specific rotation or supplying a custom rotation |
| Duration | Length of rotation in years | |
| Management events | Sequence of field operations with dates | |
| Operation Details | Operation date | Specific date each operation occurs |
| Operation type | Type of field operation (tillage, planting, harvest, etc.) | |
| Implement used | Specific implement (e.g., “Chisel, twisted shovel”) | |
| Operation parameters | Equipment-specific settings and effects | |
| Crop Information | Crop type | Specific crop being grown |
| Yield | Target or actual yield with units (e.g., 200 bu/ac) |
Background Databases
The Fieldprint Calculator connects to several sophisticated databases to supplement user inputs with detailed environmental information. These background data sources provide scientific information needed for comprehensive erosion modeling without requiring users to gather these complex data sets themselves.
The table below outlines the key background databases and the information they provide:
| Database | Information Provided | How It’s Used in the Models |
|---|---|---|
| USDA SSURGO | Soil texture | Determines infiltration, runoff, and erodibility |
| Organic matter content | Affects soil structure and water-holding capacity | |
| Inherent erodibility factors | Baseline susceptibility to erosion | |
| Soil depth and layering | Influences water movement through soil profile | |
| Soil chemical properties | Affects plant growth and soil stability | |
| PRISM Climate Data | Precipitation patterns | Drives water erosion processes |
| Temperature regimes | Influences plant growth and soil conditions | |
| Wind characteristics | Determines wind erosion potential | |
| Historic weather variability | Creates realistic climate scenarios | |
| CLIGEN Weather Generator | Daily precipitation | Used to model rainfall events |
| Temperature values | Affects plant growth and soil processes | |
| Solar radiation | Drives evapotranspiration and plant development | |
| Management Templates | Regional cropping systems | Pre-configured scenarios based on common practices |
| Custom cropping systems | User-provided management system | |
| Typical management sequences | Simplifies input for standard practices | |
| Operation parameters | Technical details for common field operations |
Model Outputs and Post-Processing
ImportantKey Output
The modeling outputs in the Fieldprint Calculator are presented as:
- Soil carbon fluxes in units of kg CO2e / ha / year for SI system or lb CO2e / acre / year for U.S. customary system units.
The following figure shows the original SWAT+ model outputs.
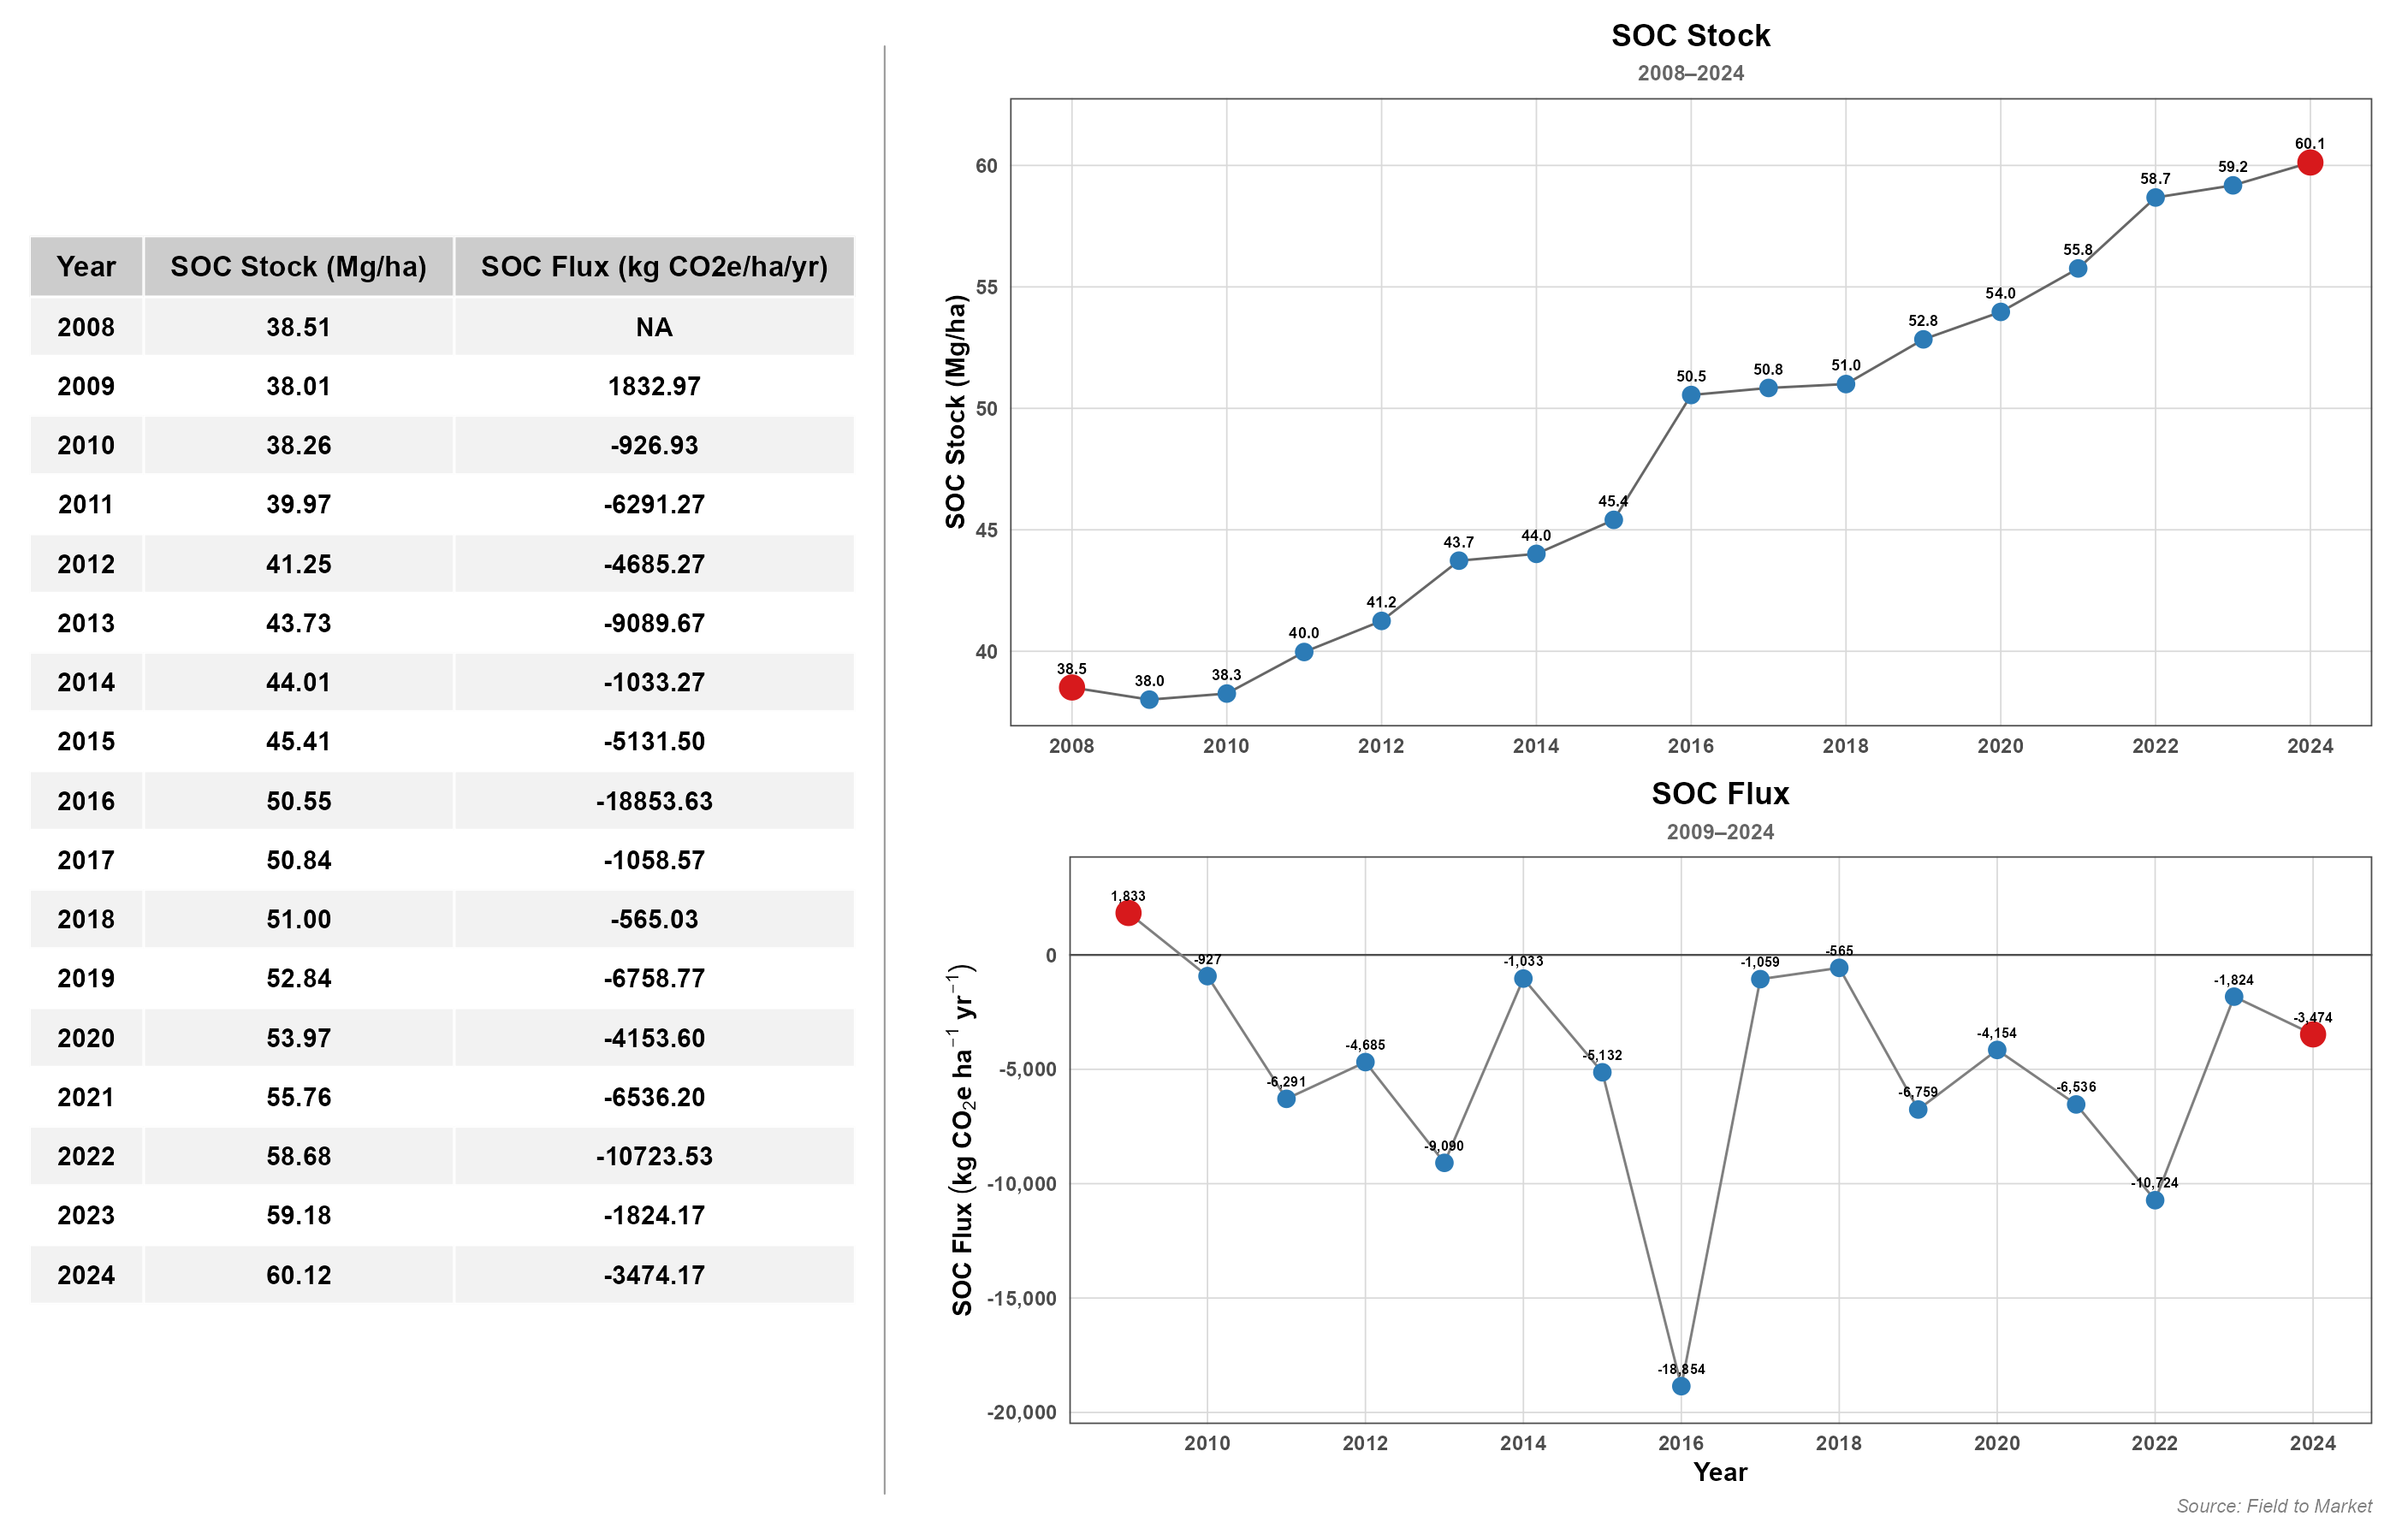
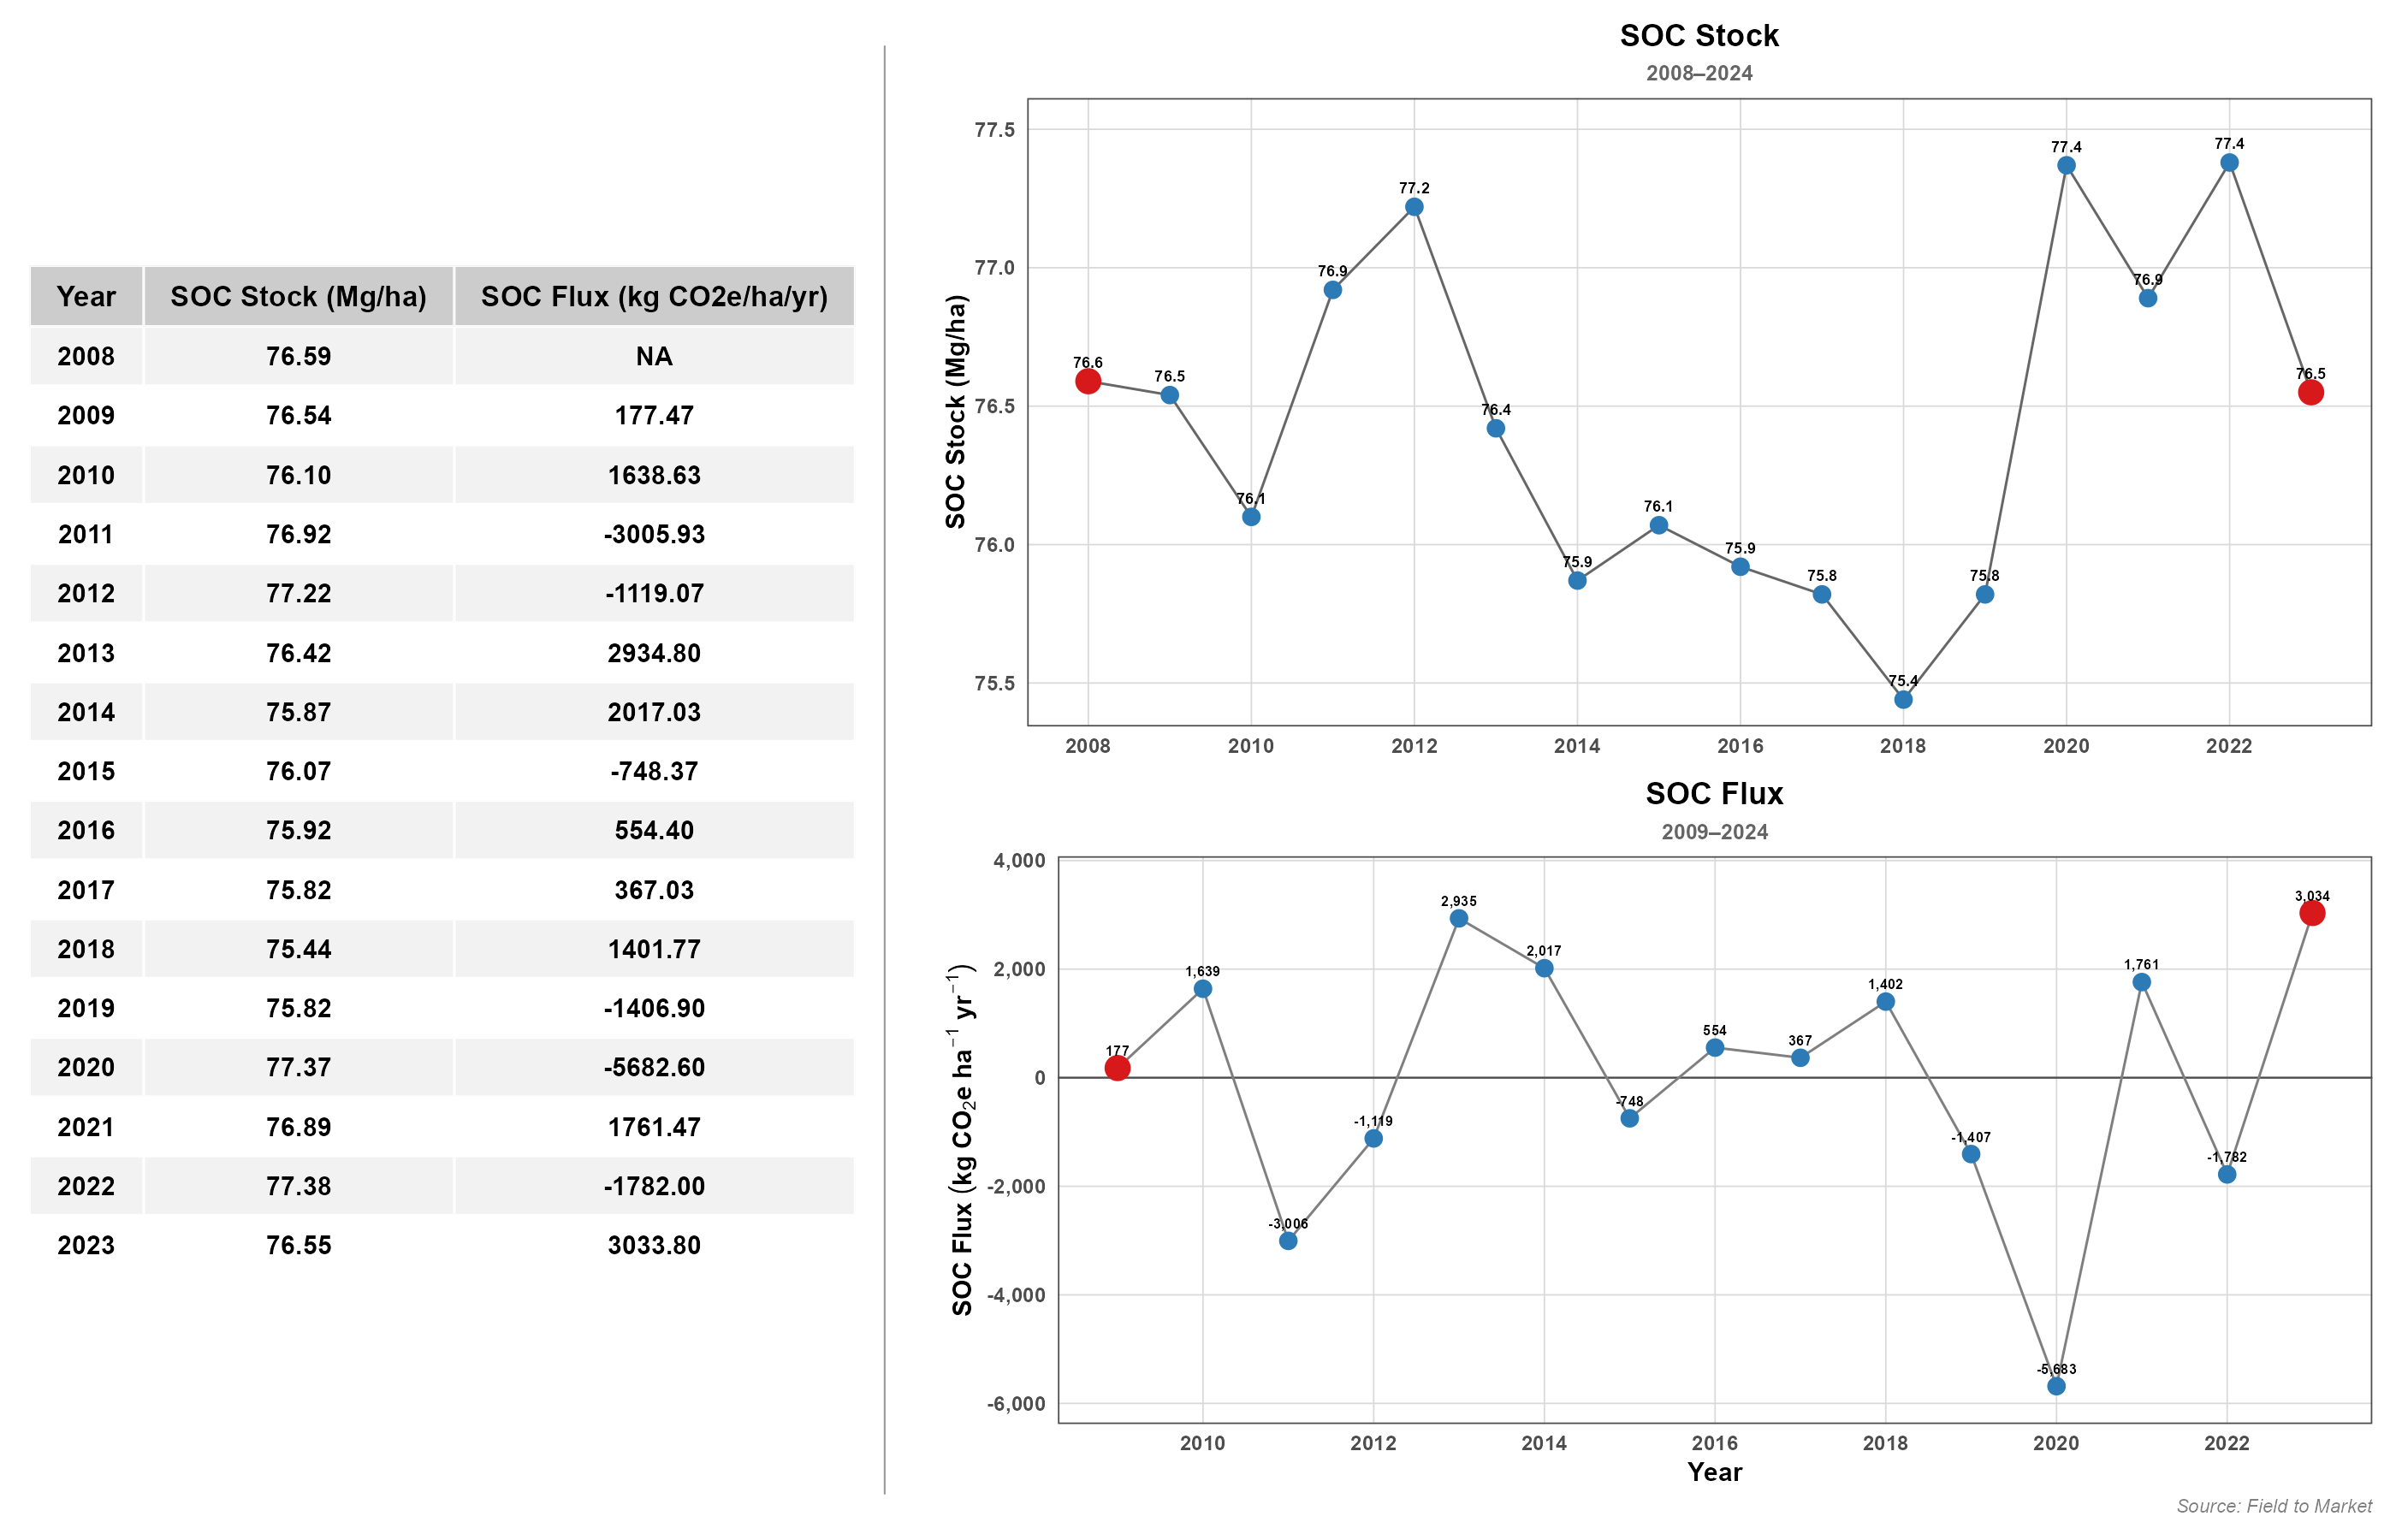
- The variable
SOC Stock (Mg/ha)represents the estimated stocks on the top 30 cm of soil for the slow, passive, and microbial carbon fractions. - The variable
SOC Flux (kg/ha/yr)is the result of the following formula:
\[ \begin{aligned} \text{SOC Flux}_t \; (\text{kg CO}_2\text{e ha}^{-1} \text{yr}^{-1}) &= \left(\text{SOC Stock}_t - \text{SOC Stock}_{t-1}\right) \\ &\quad \times 1{,}000 \times \frac{44}{12} \end{aligned} \]
In the example below, the field’s SOC stocks rise steadily over the period 2008-2024. When SOC stocks are converted to yearly fluxes, they show significant removals nearly every year, with some years close to an equilibrium state (emissions or removals hovering around zero fluxes).
The next example below shows modeled output from a field under very steady state conditions, where there is nearly no change in SOC stocks at the beginning and end of the time series. Over the modeled period, there is a mix of small amounts of emissions and removals.
Attribution of CO2 emissions or sequestration by crop interval
The Fieldprint Platform assigns CO2 sequestration or emissions to a crop interval using an area-time weighting approach according to the number of days the crop interval covers within a calendar year.
The following scenario illustrates the approach:
- Calendar year: 2023
- Soil carbon stock change estimate: 425 kg CO2 / ha / year or 1.16 kg CO2 / ha / day.
- Two crop intervals in 2023:
- 2023 soybeans (2022-10-31 to 2023-10-10), covering 283 days in 2023. This crop interval gets assigned 1.16 kg CO2 / ha / day * 283 days = 329.5 kg CO2 / ha.
- 2024 corn grain, (2023-10-11 to 2024-10-20), covering 82 days in 2023. This crop interval gets assigned 1.16 kg CO2 / ha / day * 82 days = 95.5 kg CO2 / ha.
- The soybean crop interval would also include emissions from 2022, and the corn crop interval would include emissions for 2024, using the same approach.
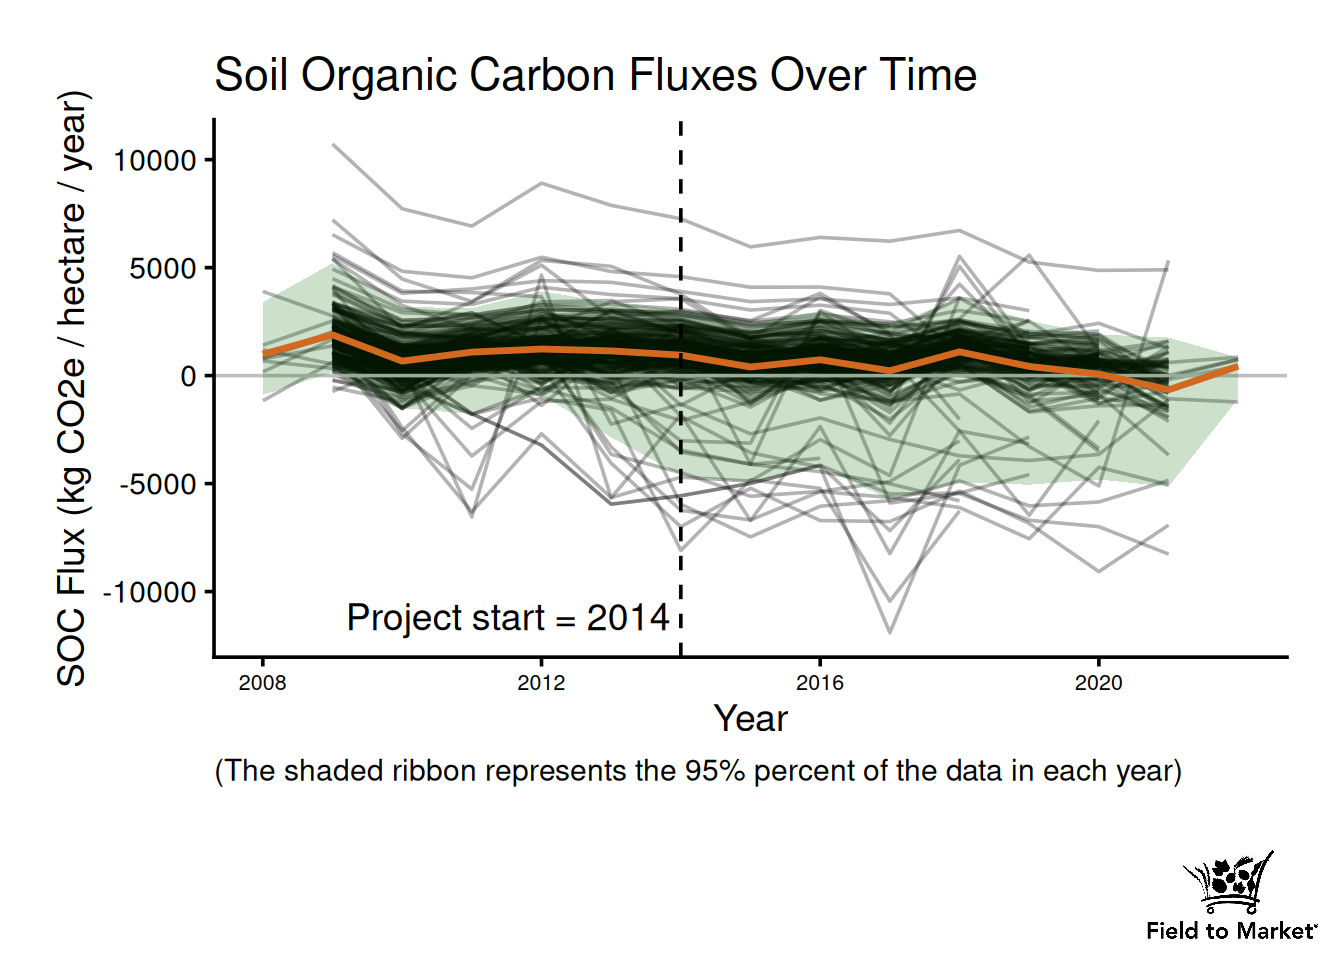
Project Output
The graph below demonstrates modeled SOC fluxes for a project with an average of 77 fields per year for the period 2017-2021. The orange line represents the average yearly fluxes, while the black lines are field-level model outputs. The green band represents 95% confidence intervals.
On average, the project estimates a small amount of emissions nearly every year. Some fields are modeled to sequester carbon intermittently.
Unit conversion reference
Several soil organic carbon (SOC) models, including SWAT+, produce results in units of Mg C / ha, reflecting changes in soil carbon stocks. However, since the Fieldprint Platform reports greenhouse gas emissions with more granularity, units of kg CO2e / ha are used.
To help users quickly convert between these two units, the table below provides a ready reference spanning the range of SOC flux values commonly encountered in agricultural systems, from net emissions (3 Mg C / ha) to significant sequestration (−3 Mg C / ha).
| Mg C / ha | kg CO₂e / ha |
|---|---|
| 3.00 | 11000.0 |
| 2.75 | 10083.3 |
| 2.50 | 9166.7 |
| 2.25 | 8250.0 |
| 2.00 | 7333.3 |
| 1.75 | 6416.7 |
| 1.50 | 5500.0 |
| 1.25 | 4583.3 |
| 1.00 | 3666.7 |
| 0.75 | 2750.0 |
| 0.50 | 1833.3 |
| 0.25 | 916.7 |
| 0.00 | 0.0 |
| -0.25 | -916.7 |
| -0.50 | -1833.3 |
| -0.75 | -2750.0 |
| -1.00 | -3666.7 |
| -1.25 | -4583.3 |
| -1.50 | -5500.0 |
| -1.75 | -6416.7 |
| -2.00 | -7333.3 |
| -2.25 | -8250.0 |
| -2.50 | -9166.7 |
| -2.75 | -10083.3 |
| -3.00 | -11000.0 |
Expected ranges from the scientific literature
To help contextualize model outputs, the table below summarizes SOC sequestration and emission rates reported across 10 peer-reviewed meta-analyses covering a range of agricultural management practices. Rates are expressed in both Mg C / ha / yr and kg CO2e / ha / yr (converted using the factor 1 Mg C / ha = 3,667 kg CO2e / ha). Values follow the SWAT+ sign convention used throughout the Fieldprint Platform: negative values indicate sequestration (carbon removed from the atmosphere and stored in the soil), and positive values indicate emissions (carbon released from the soil to the atmosphere). Users can use these ranges as a benchmark when interpreting field- or project-level results from SWAT+.
| Citation | Practice | SOC Range (Mg C / ha / yr) | CO₂e Range (kg CO₂e / ha / yr) |
|---|---|---|---|
| West & Post (2002) | No-till vs. conventional tillage | -0.71 to -0.43 | -2603 to -1577 |
| West & Post (2002) | Enhanced crop rotation complexity | -0.32 to -0.08 | -1173 to -293 |
| Luo et al. (2010) | No-till (full profile, 0–40 cm) | -0.22 to 0.1 | -807 to 367 |
| Poeplau & Don (2015) | Cover crops in annual rotations | -1 to -0.1 | -3667 to -367 |
| Maillard & Angers (2014) | Animal manure application | -0.82 to -0.31 | -3007 to -1137 |
| Gross & Glaser (2021) | Manure application (updated global) | -1.1 to -0.5 | -4033 to -1833 |
| Gross, Bromm & Glaser (2021) | Biochar application (1–100 Mg ha⁻¹) | -13 to -1.3 | -47667 to -4767 |
| Mayer et al. (2022) | Temperate agroforestry systems | -1.4 to 0.5 | -5133 to 1833 |
| Jian et al. (2020) | Cover crops in global croplands | -0.72 to -0.4 | -2640 to -1467 |
| Siddique et al. (2023) | Perennial energy crops (miscanthus, switchgrass) | -1.3 to -0.21 | -4767 to -770 |
| Kämpf et al. (2016) | Reduced tillage / land-use change to grassland | -0.9 to -0.5 | -3300 to -1833 |
Frequently Asked Questions
Question: The Soil Carbon score for one of my fields estimates soil carbon sequestration, but the Soil Conservation score estimates soil erosion losses. How is this possible?
- Answer: The answer lies in the fact that these two indicators are measuring different processes occurring at different depths of the soil profile. The Soil Carbon indicator estimates changes in soil organic carbon stocks within the top 0–30 cm of the soil profile, capturing the net balance of carbon inputs (e.g., from root biomass, residue decomposition, and organic amendments) and carbon losses (e.g., from microbial decomposition and mineralization) over time. A field can show net carbon sequestration in this zone when management practices — such as reduced tillage, cover cropping, or diverse rotations — increase carbon inputs or slow decomposition rates faster than carbon is being lost. The Soil Conservation indicator, by contrast, estimates the physical loss of topsoil from the surface due to wind and water erosion. This process affects only the uppermost layer of soil that is directly exposed to rainfall impact, surface runoff, and wind forces. A field can simultaneously be building carbon at depth within the 0–30 cm profile while still experiencing surface soil erosion, particularly if conservation practices have improved subsurface carbon dynamics but have not fully mitigated surface erosion risk. These two indicators together provide a more complete picture of soil health: one tracking the carbon balance within the rooting zone, and the other tracking the physical integrity of the soil surface.
Question: I have only heard of SWAT. What is SWAT+?
- Answer: Over the past 20 years, the Soil and Water Assessment Tool (SWAT) has become widely used worldwide. Various applications of the model have revealed limitations and identified model development needs. Numerous additions and modifications of the model and its components have made the code increasingly challenging to manage and maintain. In response to these issues and to address present and future challenges in water resources modeling, the SWAT code has undergone significant modifications over the past few years, resulting in SWAT+, a completely restructured version of the model. The algorithms used to calculate the processes in the model have remained unchanged; however, the structure and organization of both the code (object-based) and the input files (relational-based) have been significantly improved. This will facilitate model maintenance, future code modifications, and foster collaboration among researchers to integrate new science into SWAT+ modules. Additionally, SWAT+ provides a more flexible spatial representation of interactions and processes within a watershed.
Question: Can SWAT+ be considered as a Tier 3 model under IPCC Guidelines?
- Answer: When coupled with additional calibration and validation against observed data, SWAT+ aligns with the IPCC’s definition of a Tier 3 methodology. SWAT+ is a biophysical model capable of simulating complex soil and watershed processes at various spatial and temporal scales, from fields to small and large watersheds over any desired period of time. The model is comprehensive in nature, requiring detailed input data on topography, land use, soil properties, climate, and management practices, allowing for field-level estimations. SWAT+ can simulate processes such as soil carbon dynamics, surface runoff, infiltration, evapotranspiration, groundwater flow, sediment transport, and nutrient cycling. Tier 3 models are characterized by their comprehensive approaches, disaggregation of activity data, and the use of the latest scientific knowledge to provide granular estimates of variables of interest such as greenhouse gas emissions and removals.
Question: Is SWAT+ calibrated?
- Answer: The model can be considered calibrated. The SWAT+ model implementation by CSU provides a calibrated model service with localized weather, soil properties, and crop growth modules. Modeling of SOC dynamics for other crops and/or regions outside the Midwest will rely on parameters from the USDA ARS National Agroecosystems Model, built-in parameters, and parameters from the scientific literature.
Question: Is SWAT+ validated?
- Answer: Colorado State University is in the process of validating SWAT+ to simulate soil organic carbon (SOC) dynamics in the U.S. Corn Belt. This model validation effort focuses on cropping systems that include corn, soybeans, and wheat, among other rotational crops, which collectively comprise 92% of the Field to Market’s project acres. Model uncertainty quantification will be provided for crops and regions with sufficient data. The model output from SWAT+ should be considered sufficient for Scope 3 reporting.
Interim Technical Note on SWAT+ Plant and Soil Carbon Dynamics
Authored by Jack Carlson, Olaf David, and Frank Geter (May 29, 2025)
This document describes the plant and soil carbon pools and fluxes modeled by the version of the SWAT+ model supporting the Field-to-Market (FtM) Fieldprint Platform (FPP). The document also describes how SWAT+ models soil organic carbon (SOC) changes over time through adjustments to crop management. The model assumes soil organic matter is 58% carbon. The model also tracks carbon losses in runoff, eroded sediment, percolate, and subsurface lateral flow. SWAT+ models nitrogen (N) and phosphorus (P) pools and their fluxes, together with carbon (C) enabling assessments of how to optimize their use to grow crops, control nutrient losses, maintain soil health, and help build organic matter through sequestration.
The SWAT+ model runs a daily time step, updating biophysical conditions each day through the simulation period. For FtM, SWAT+ provides what is called edge-of-field output representing biophysical conditions and constituents on or leaving one field. SWAT+ models what is called a hydrologic response unit (HRU) and for FtM, a farm field represents one HRU. A farm field may have more than one soil, but a SWAT+ model web service aggregates and weights soil-specific output to represent the field. SWAT+ can route constituents (sediment, nutrients, pesticides, salts, etc.) from HRU to HRU and channels through a watershed, however, this capability is not within the FtM scope for now.
Live Plant Biomass Carbon
SWAT+ daily simulates crop biomass production during the period from planting to harvest or termination, allocating biomass to leaves, stems, seeds, and roots. The model can simulate biomass production from more than one crop growing at the same time, for example interseeded or late terminated cover crops, or relay cropping. The model separates aboveground from below ground biomass, enabling source carbon to be modeled in the soil and above ground. The model considers biomass to be 42% carbon, the primary year to year source for any sequestration in the soil.
Dead Biomass Residue Carbon
Upon harvesting and terminating a crop, SWAT+ transfers aboveground killed biomass to the residue pool of the surface soil layer. For each subsequent soil layer below ground, the model transfers dead root biomass to the residue pool according to the layer’s fraction of root mass in the soil.
Soil Layers
For FtM, the soil profile has been divided into 15 soil hydrology layers at depths mostly aligned with those recommended for the DayCent model.
- Layer 1: Surface to 10 mm depth
- Layer 2: 10 - 25 mm
- Layer 3: 25 - 50 mm
- Layer 4: 50 - 100 mm
- Layer 5: 100 - 200 mm
- Layer 6: 200 - 300 mm
- Layer 7: 300 - 450 mm
- Layer 8: 450 - 600 mm
- Layer 9: 600 - 750 mm
- Layer 10: 750 - 900 mm
- Layer 11: 900 - 1050 mm
- Layer 12: 1050 - 1200 mm
- Layer 13: 1200 - 1500 mm
- Layer 14: 1500 - 1800 mm
- Layer 15: 1800 - 2100 mm
The soil parameters (e.g. bulk density, clay %, pH, etc.) for each soil hydrology layer bounding a SDM SSURGO horizon boundary are weighted according to the contribution from the soil horizons to the soil hydrology layer.
The top 10 mm surface layer depth inherits the soil parameters from the SDM SSURGO surface soil horizon. This thin layer is an abstraction to the extent the dead residue component can be much thicker than 10 mm, laying on the surface above the soil, some/much of the residue standing, sometimes several centimeters high.
Tillage and Biomixing
The day after harvest and transfer of live plant biomass to dead residue biomass, if tillage does not occur to mix some fraction of the residue into the soil to a specified tillage depth, the model applies biomixing representing earthworms, insects, and other natural churning to a 100 mm depth (~4 inches).
Dead Residue Daily Availability for Decomposition/Transformation
Dead residue following harvest or application can be standing stalks/stems/leaves, laying flat, shredded, pulverized, or not, accessible to microbes or not. From dead residue stock, the model makes a small fraction available for decomposition each day, allocating 85% of it to the metabolic litter carbon pool and 15% to structural litter carbon pool. Structural litter divides into 80% lignin and 20% non-lignin. At the surface these litter pools essentially form the top 10mm surface layer, inheriting properties from the surface soil horizon as well. Below ground the same allocation occurs with dead root litter. The allocation percentages do not vary from day to day, remaining fixed through the simulation.
Metabolic Litter Carbon Pool
Metabolic litter decomposes rapidly in days to a few weeks containing carbon readily consumed by microbes, mainly soft plant tissue (proteins, sugars). The rate (meta_rate parameter) at which a microbial community can transform metabolic litter carbon can be calibrated.
The meta_rate parameter represents the maximum transformation rate for a microbially stable undisturbed condition. The maximum rate increases with tillage disturbance triggering a large microbial response, and decreases with sub-optimal soil moisture and temperature, and below ground with decreasing oxygen. The adjusted rate becomes the potential transformation potential rate for location and day. The model further adjusts the rate by comparing the demand for nitrogen by microbes transforming the carbon to the supply of available nitrogen, adjusting the potential to an actual site-specific transformation rate.
For each day in the simulation, SWAT+ computes the transformed carbon amount, then emits a fraction as CO2 with the remainder fluxed into the microbial carbon pool. The CO2 emission parameter (a1co2) controls the fraction emitted and can be calibrated. A default value (from precursor CENTURY model) of 0.60 for the surface layer (0.55 for subsurface layers) means 60% (or 55%) of daily transformed metabolic litter carbon returns to the atmosphere as CO2. The a1co2 parameter exerts significant control over the amount of carbon that flows into the sequestered carbon pools.
Structural Litter Carbon Pool
Structural litter, mainly cell walls and the 80% lignin fraction, at the surface or below ground, decomposes less rapidly on the order of weeks to months. SWAT+ applies the same processes described above with metabolic litter to compute an actual transformation rate for this pool. The maximum transformation rate parameter (str_rate) controls decomposition of this pool, adjusted by tillage, soil moisture, and temperature effects, N demand and supply to produce a potential and then daily site-specific actual transformation rate. Microbes act on the 80% lignin fraction breaking it into very fine particulates that become sequestered in the slow humus carbon pool in soil aggregates isolated from further attack. Only 30% of microbially transformed lignin emits as CO2, the rest fluxing into the slow humus pool. The transformed 20% non-lignin fraction fluxes into the microbial carbon pool, emitting CO2 at the same rate as the metabolic pool (controlled by the a1co2 parameter)
Microbial Carbon Pool
Live microbial biomass forms the highly active microbial carbon pool, about 2% of sequestered carbon in the soil. Microbes consume and process fresh carbon from litter pools. Live microbial mass is short-lived, turning over rapidly, its remnant carbon having been transformed to more complex molecules, which take more energy thus harder to break down. Resistant carbon stands alone, becomes protected in soil aggregates and micropores, or binds to minerals, forming the transformed amount fluxing to the slow and passive humus carbon pools. The microbial pool has a maximum transformation rate (microb_rate) controlling its turnover, adjusted to a potential rate as described above, and further to a daily actual rate. Then at the surface layer, the abco2 parameter controls the amount of transformed carbon emitted as CO2, and sand content controls the amount emitted from the subsurface layers. Remaining transformed microbial pool carbon fluxes into the passive humus pool controlled by soil clay content (more clay, more mineral adsorbed carbon), and the rest fluxes into the slow humus carbon pool.
After all carbon pool transformations and fluxes are resolved for the day, if a precipitation and runoff event has occurred, SWAT+ extracts carbon from the microbial pool into solution, allocating it in the surface layer to horizontal flow runoff and sediment, and vertical flow percolation; and in subsurface layers to horizontal lateral flow and vertical flow percolation. KOC, the organic carbon water partition coefficient (PRMT_21 parameter) controls the rate at which microbial pool carbon goes into solution. The ratio of soluble C concentration in runoff to percolate (PRMT_44 parameter) controls the amount of carbon that flows horizontally in runoff, sediment, and lateral flow, and vertically through percolation.
Slow Humus Carbon Pool
The slow humus carbon pool typically contains 50-60% of sequestered carbon in the soil. It resists degradation because it is inaccessible to microbes, and if accessible, microbes find the complex carbon molecules less rewarding and harder to break down. This resistance is what gives the slow pool intermediate stability, allowing it to store carbon for years to decades. On the other hand, microbes act on the slow humus pool, influenced by several factors: temperature, moisture, microbial diversity, soil pH, chemical weathering, nutrient inputs, carbon priming, and soil disturbance by tillage or biomixing. The slow humus pool has a maximum (slow) decomposition rate (hs_rate) controlling its stability, adjusted by tillage, soil moisture, and temperature effects, N demand and supply to produce a potential and then daily site-specific actual transformation rate. Half or more transformed slow pool carbon emits as CO2 (the rate controlled by the asco2 parameter), some binds to minerals fluxing to the passive carbon pool (controlled by the hs_hp parameter), and the remainder returns to the microbial carbon pool, especially when tillage disturbs and mixes the soil.
Passive Humus Carbon Pool
The passive humus carbon pool contains 40-50% of sequestered carbon in the soil, highly resistant to decomposition, persisting in the soil for hundreds of years, consisting of highly processed organic matter from long-term microbial activity, chemically complex, tightly bound to clay minerals or metal oxides. A relatively small fraction of carbon input reaches the passive humus pool, accumulating very slowly, but can be degraded through intensive tillage or other extreme disturbance. The passive humus pool has a maximum (very slow) decomposition rate (hp_rate) controlling its stability, adjusted by tillage, soil moisture, and temperature effects, N demand and supply to produce a potential and then daily site-specific actual transformation rate. Transformed slow pool emits as CO2 (the rate controlled by the apco2 parameter), the remainder returning to the microbial carbon pool.
Practice Effects
Several cropping system management practices help achieve a new equilibrium that maintains or improves soil health, organic matter, and carbon stock.
Reduced Tillage
Tillage mixes the soil exposing sequestered carbon to further decomposition by microbes, while emitting half or more of the exposed carbon to the atmosphere as CO2. The increase in available carbon triggers an increase in the microbial mass. SWAT+ applies a tillage effect factor (multiplier) accounting for the increased microbial activity. The effect of a tillage operation lasts 30 days. Multiple high-mixing deep tillage passes can increase microbial activity several fold, causing significant declines in soil carbon unless offset by increasing source carbon (residues). Reducing tillage in a cropping system achieves a higher soil carbon equilibrium. The SWAT+ tillage effect factor is a function involving soil mixing efficiency, tillage depth, and clay content.
Cover Crops
Cover crops provide above and below ground residues as a source for building carbon in the soil. They also consume carryover and applied nutrients, keeping them in the root zone for slow release to the following commercial crop, rather than losing them to leaching. Cereal and grass cover crops produce the most residue, whereas legumes, although producing less residue, fix nitrogen from the atmosphere, making it available to the following crop. Deep taproot broadleaf cover crops can scavenge nutrients from deeper soil layers, directly benefiting the following crop, also improving nutrient supply necessary for carbon flux to the stable humus pools. Interseeding cover crops into not yet harvested commercial crops and/or terminating cover crops after planting the next commercial crop further increases source carbon and helps ensure the cover crop takes advantage of available warm fall weather and the spring growth flush, optimizing its benefit.
Several parameters control cover crop performance: days to maturity (days_mat), leaf area index potential (lai_pot), minimum and optimum temperature for plant growth (tmp_base, tmp_opt), biomass-energy ratio (bm_e), and maximum rooting depth (rt_dp_max).
Multi-Cropping
Growing multiple crops during the year increases source residue carbon above and below ground, the goal to keep live crop roots in the ground for as many days in the year as possible with sufficient soil moisture. The parameters referenced in the cover crop section above, plus harvest index (harv_idx) control the performance of crops used in multi-crop managements.
High Residue Crops
Including high residue crops (corn, wheat, sorghum, etc.) in a long-term cropping sequence helps ensure sufficient source carbon is produced to maintain or increase soil carbon stock.
Perennial Crops
Perennial hay and pasture crops have much more extensive root systems than annual crops, building carbon more rapidly as 20-50% of the root system dies and is replaced by annual plant growth each year. SWAT+ simulates shoot and root senescence, the amount a function of growth and leaf area decline affected by growth stage, temperature and moisture stress.
Nutrient Management
Well managed nutrient applications promote higher crop and root biomass, thus high yields and more carbon returned to the soil via roots, residues, and rhizodeposition, containing sufficient N and P for microbes to decompose litter and flux carbon to sequestered pools at expected rates. Nutrient stress decreases both crop yield and soil carbon. Excess nitrogen results in nitrous oxide pulses following precipitation (or irrigation) events, increasing input costs and offsetting any soil carbon benefit. SWAT+ for FtM models effects of nutrient application amounts and timing on crop yield, biomass, residues, litter carbon pools and their transformation and flux to the sequestered soil carbon pools. The model does not yet simulate N2O emissions.
References
Abatzoglou, John T. 2013. “Development of Gridded Surface Meteorological Data for Ecological Applications and Modelling.” International Journal of Climatology 33 (1): 121–31.
Adams, Brian M., Lara E. Bauman, William J. Bohnhoff, et al. 2014. Dakota, a Multilevel Parallel Object-Oriented Framework for Design Optimization, Parameter Estimation, Uncertainty Quantification, and Sensitivity Analysis: Version 6.1 User’s Manual. Nos. SAND2014-4633. Sandia National Laboratories. https://dakota.sandia.gov/.
Arabi, Mazdak, Rao S Govindaraju, and Mohamed M Hantush. 2007. “A Probabilistic Approach for Analysis of Uncertainty in the Evaluation of Watershed Management Practices.” Journal of Hydrology 333 (2-4): 459–71.
Arnold, Jeffrey G, Katrin Bieger, Michael J White, Raghavan Srinivasan, John A Dunbar, and Peter M Allen. 2018. “Use of Decision Tables to Simulate Management in SWAT+.” Water 10 (6): 713.
Arnold, Jeffrey G, Natalja Čerkasova, Michael J White, et al. 2024. Soil and Water Assessment Tool Plus (SWAT+). Released August. https://github.com/swat-model/swatplus.
Arnold, Jeffrey G, Daniel N Moriasi, Philip W Gassman, et al. 2012. “SWAT: Model Use, Calibration, and Validation.” Transactions of the ASABE 55 (4): 1491–508.
Arnold, Jeffrey G, Mohamed A Youssef, Haw Yen, et al. 2015. “Hydrological Processes and Model Representation: Impact of Soft Data on Calibration.” Transactions of the ASABE 58 (6): 1637–60.
Bieger, Katrin, Jeffrey G. Arnold, Hendrik Rathjens, et al. 2017. “Introduction to SWAT+, a Completely Restructured Version of the Soil and Water Assessment Tool.” JAWRA Journal of the American Water Resources Association 53 (1): 115–30. https://doi.org/10.1111/1752-1688.12482.
Boryan, Claire, Zhengwei Yang, Rick Mueller, and Mike Craig. 2011. “Monitoring US Agriculture: The US Department of Agriculture, National Agricultural Statistics Service, Cropland Data Layer Program.” Geocarto International 26 (5): 341358.
Čerkasova, Natalja, Michael White, Jeffrey Arnold, et al. 2023. “Field Scale SWAT+ Modeling of Corn and Soybean Yields for the Contiguous United States: National Agroecosystem Model Development.” Agricultural Systems 210: 103695.
Chawanda, Celray James, Jeffrey Arnold, Wim Thiery, and Ann van Griensven. 2020. “Mass Balance Calibration and Reservoir Representations for Large-Scale Hydrological Impact Studies Using SWAT+.” Climatic Change 163: 1307–27.
David, Olaf, Jeffrey Arnold, Natalja Čerkasova, et al. 2024. SWAT+ Carbon. 2024 SWAT Conference (Strasbourg, France). https://swat.tamu.edu/media/0t5c4bul/olaf.pdf.
David, Olaf, Wes Lloyd, Ken Rojas, et al. 2014. Model-as-a-Service (MaaS) Using the Cloud Services Innovation Platform (CSIP).
Del Grosso, Stephen J, WJ Parton, CA Keough, and M Reyes-Fox. 2011. “Special Features of the DayCent Modeling Package and Additional Procedures for Parameterization, Calibration, Validation, and Applications.” Methods of Introducing System Models into Agricultural Research 2: 155–76.
Du, Xinzhong, Xuesong Zhang, Rajith Mukundan, Linh Hoang, and Emmet M Owens. 2019. “Integrating Terrestrial and Aquatic Processes Toward Watershed Scale Modeling of Dissolved Organic Carbon Fluxes.” Environmental Pollution 249: 125135.
Duriancik, Lisa F, Dale Bucks, James P Dobrowolski, et al. 2008. “The First Five Years of the Conservation Effects Assessment Project.” Journal of Soil and Water Conservation 63 (6): 185A–197A.
Field to Market. 2021. Soil Carbon. National Indicators Report. https://fieldtomarket.org/national-indicators-report/soil-carbon/.
Flanagan, Dennis C, James R Frankenberger, Chris S Renschler, et al. 2024. “Water Erosion Prediction Project (WEPP) Model 2024 Status.” 2024 ASABE Annual International Meeting, 1.
Free Software Foundation. 1999. GNU Lesser General Public License V2.1. https://www.gnu.org/licenses/old-licenses/lgpl-2.1-standalone.html.
Greenhouse Gas Protocol. 2024. GHG Protocol Launches the Built on GHG Protocol Mark. Https://ghgprotocol.org/ghg-protocol-launches-built-ghg-protocol-mark. https://ghgprotocol.org/ghg-protocol-launches-built-ghg-protocol-mark.
Izaurralde, RC, Jimmy R Williams, William B McGill, Norman J Rosenberg, and MC Quiroga Jakas. 2006. “Simulating Soil c Dynamics with EPIC: Model Description and Testing Against Long-Term Data.” Ecological Modelling 192 (3-4): 362–84.
Jeong, Jaehak, Jeffery Arnold, Seonggyu Park, Ricardo Sorando, Soon-Kun Choi, and Min-Kyeong Kim. 2025. “Enhancement of the SWAT+ Model for Simulating Paddy Rice Cultivation and Irrigation Management in Agricultural Watersheds.” Journal of Hydrology 659: 133288.
Kucera, Michael J., and Christopher B. Coreil. 2023. “Overview of USDA-NRCS Erosion Prediction Technology and Conservation Resources - Land Management Operations Database and Use.” Soil Erosion Research Under a Changing Climate, January 8-13, 2023, Aguadilla, Puerto Rico, USA, ahead of print. https://doi.org/10.13031/soil.23007.
Liang, Kang, Junyu Qi, Xuesong Zhang, and Jia Deng. 2022. “Replicating Measured Site-Scale Soil Organic Carbon Dynamics in the US Corn Belt Using the SWAT-c Model.” Environmental Modelling & Software 158: 105553.
Mausbach, Maurice J, and Allen R Dedrick. 2004. “The Length We Go: Measuring Environmental Benefits of Conservation Practices.” Journal of Soil and Water Conservation 59 (5): 96A–.
Sanderman, Jonathan, Tomislav Hengl, and Gregory J. Fiske. 2017. “Soil Carbon Debt of 12,000 Years of Human Land Use.” Proceedings of the National Academy of Sciences 114 (36): 9575–80. https://doi.org/10.1073/pnas.1706103114.
Seibert, Jan, and Jeffrey J McDonnell. 2002. “On the Dialog Between Experimentalist and Modeler in Catchment Hydrology: Use of Soft Data for Multicriteria Model Calibration.” Water Resources Research 38 (11): 23–21.
Soil Survey Staff. n.d. Soil Survey Geographic (SSURGO) Database. Natural Resources Conservation Service, United States Department of Agriculture; Web Soil Survey. https://websoilsurvey.nrcs.usda.gov/.
SWAT Development Team. 2026. Documentation: Soil & Water Assessment Tool (SWAT). Texas A&M AgriLife Research, USDA Agricultural Research Service; https://swat.tamu.edu/docs/. https://swat.tamu.edu/docs/.
Tasdighi, Ali, Mazdak Arabi, and Daren Harmel. 2018. “A Probabilistic Appraisal of Rainfall-Runoff Modeling Approaches Within SWAT in Mixed Land Use Watersheds.” Journal of Hydrology 564: 476–89.
Tasdighi, Ali, Mazdak Arabi, Daren Harmel, and Daniel Line. 2018. “A Bayesian Total Uncertainty Analysis Framework for Assessment of Management Practices Using Watershed Models.” Environmental Modelling & Software 108: 240–52.
U.S. Department of Agriculture. 2024. Documentation of Literature, Data, and Modeling: Durability of Climate-Smart Agriculture Practices. U.S. Department of Agriculture. https://www.usda.gov/sites/default/files/documents/USDA_Durability_WhitePaper_01_14.pdf.
U.S. Global Change Research Program. 2018. “Chapter 12: Soils.” In Second State of the Carbon Cycle Report (SOCCR2). U.S. Global Change Research Program. https://carbon2018.globalchange.gov/chapter/12/.
USDA. 2003. “The Soil Conditioning Index.” Agronomy Technical Note No. 1 (Revised). https://efotg.sc.egov.usda.gov/references/public/WA/A.1Soil_Conditioning_Index.pdf.
USDA Climate Hubs. 2026. A Renewed Focus on Soil Carbon. Northeast Climate Hub. https://www.climatehubs.usda.gov/hubs/northeast/topic/renewed-focus-soil-carbon.
Wagner, Larry E. 2013. “A History of Wind Erosion Prediction Models in the United States Department of Agriculture: The Wind Erosion Prediction System (WEPS).” Aeolian Research 10 (September): 9–24. https://doi.org/10.1016/j.aeolia.2012.10.001.
Yen, Haw, Michael J White, Jeffrey G Arnold, et al. 2016. “Western Lake Erie Basin: Soft-Data-Constrained, NHDPlus Resolution Watershed Modeling and Exploration of Applicable Conservation Scenarios.” Science of the Total Environment 569: 1265–81.
Zhang, Xuesong, R. César Izaurralde, Jeffrey G. Arnold, Jimmy R. Williams, and Raghavan Srinivasan. 2013. “Modifying the Soil and Water Assessment Tool to Simulate Cropland Carbon Flux: Model Development and Initial Evaluation.” Science of The Total Environment 463-464 (October): 810822. https://doi.org/10.1016/j.scitotenv.2013.06.056.