| drying_system | gas_mj_per_kg_water | electric_mj_per_kg_water |
|---|---|---|
| Hay Dryer Without Gas Heating | 0 | 3.72 |
| Hay Dryer With Gas Heating | 3.84 | 1.28 |
Drying and related post-harvest processing
Methods 5.0
upstream
on-farm mechanical
postharvest
Energy and emissions related to post-harvest processing activities like drying and ginning.
Introduction
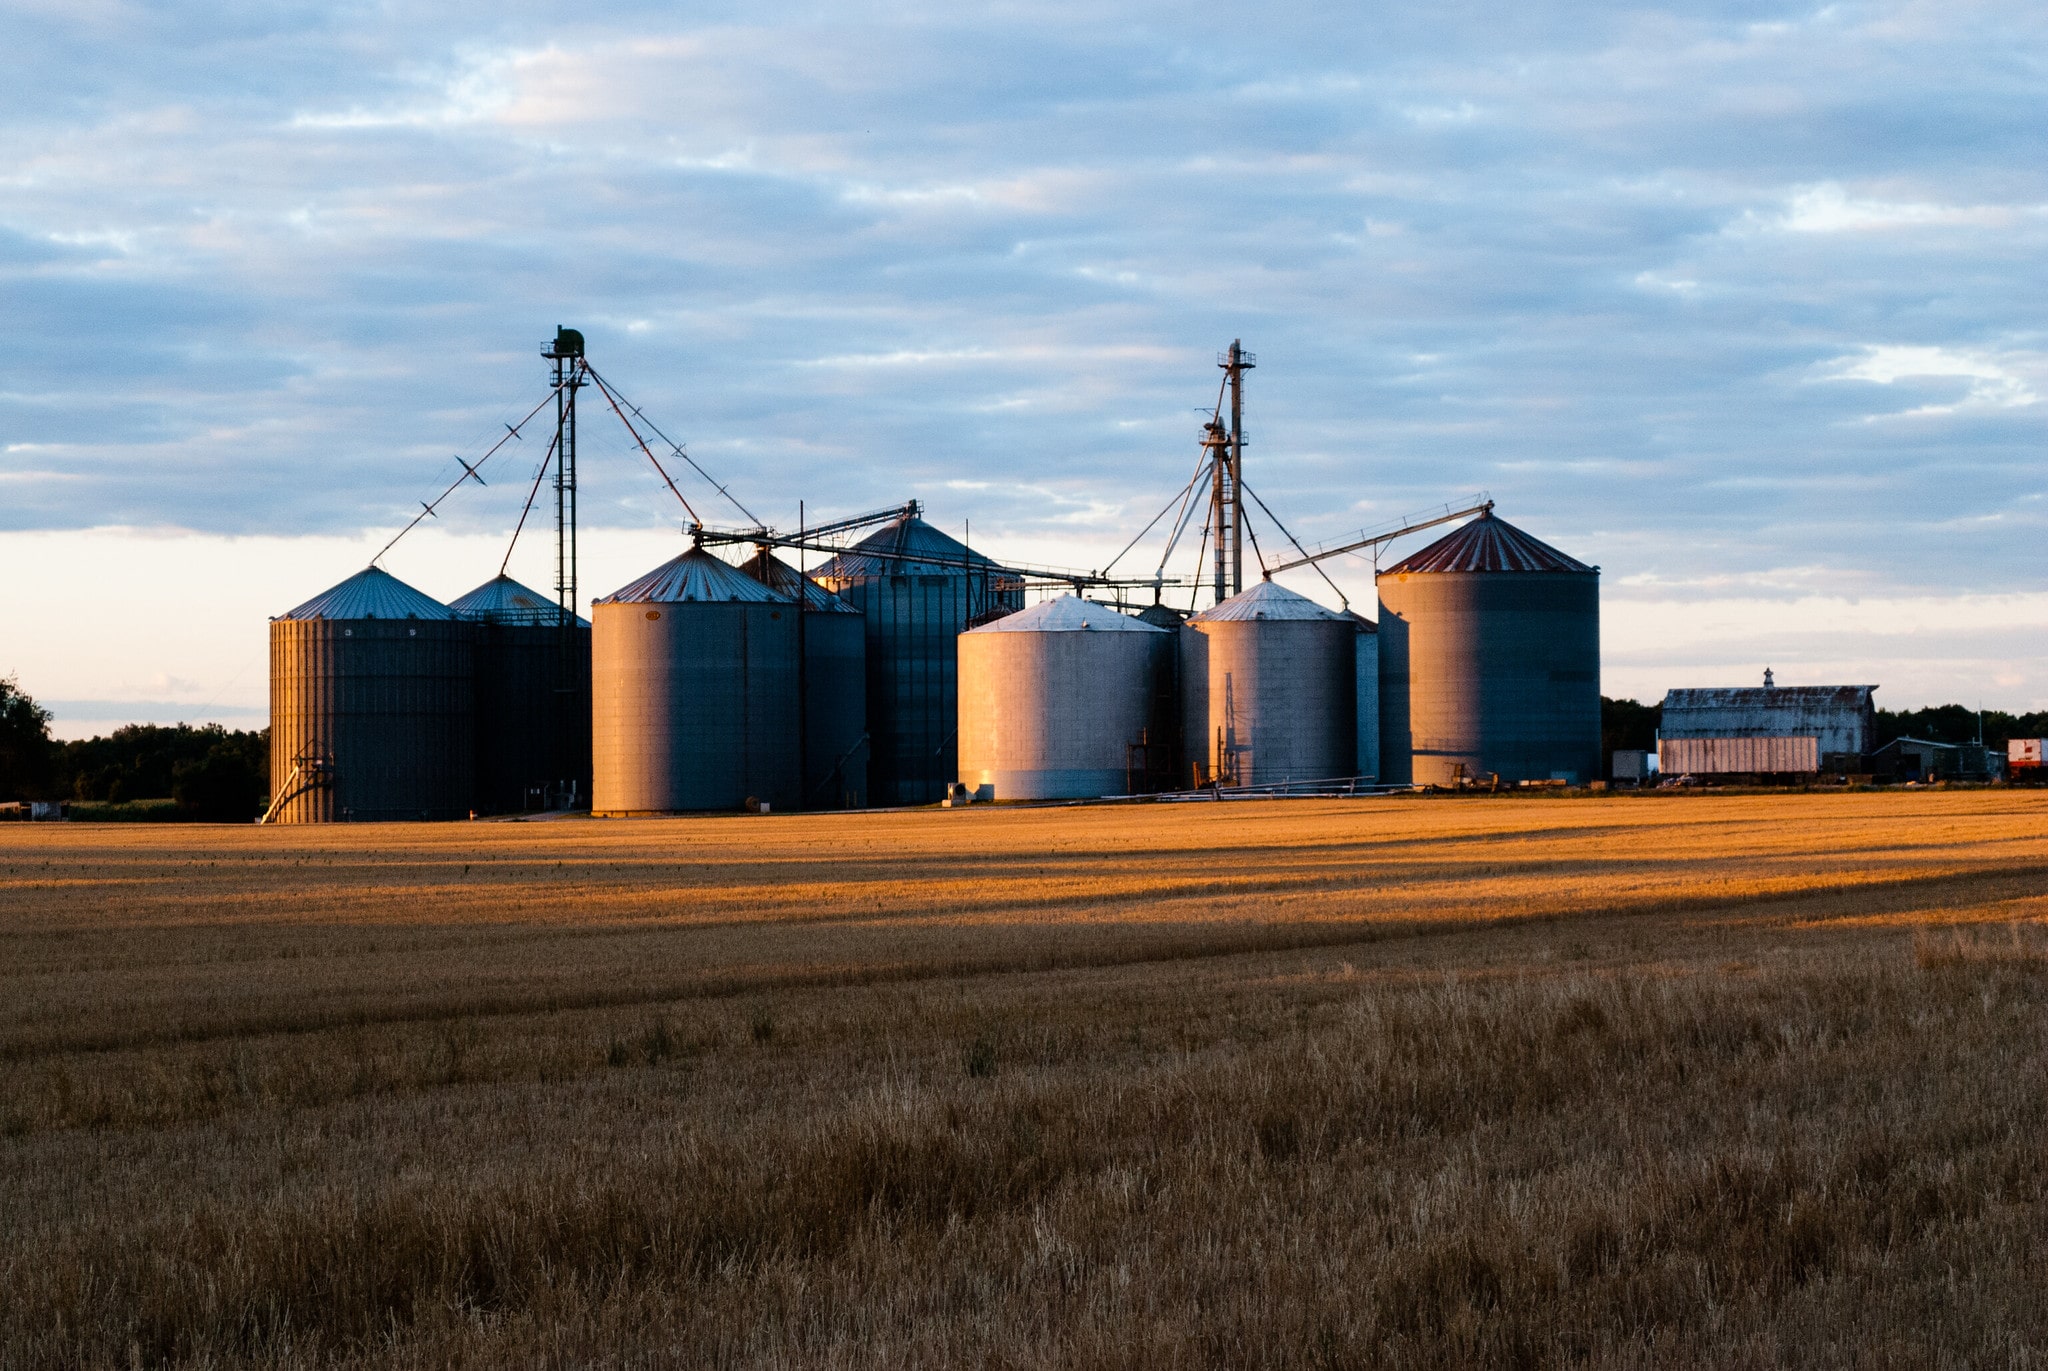
Post-harvest processes like crop drying may contribute significantly to the total GHGs in agriculture sector (Panigrahi et al. 2023). Drying is the most common form of post-harvest energy use and emissions in the Fieldprint Platform. Drying energy is based on the amount of water removed from a crop and the efficiency of the selected system to remove that water. There are many conditions that affect drying, and values can range from 1200-3200 BTU/lb of water removed. Many options are provided in the methods.
Methods
Logic for System Boundaries
Whether the transportation energy use and associated GHG emissions are assigned to “On-Farm Mechanical” or “Post-Harvest” (i.e. “Off-Farm”) depends on the crop and the location of post-harvest processing.
If the user indicates that an on-farm facility was used for drying/storage, the Calculator will assign drying energy and emissions to “On-Farm Mechanical”.
If the user indicates that an off-farm facility was used for drying/storage, the Calculator will assign transportation energy and emissions to “Post-harvest”.
Most grain crops + pulses
This first section is applicable to corn, pulse crops, sorghum, soybean, barley, rice, and wheat.
To calculate drying energy, we must first estimate the mass of water removed. The difference between the initial moisture content and the final moisture content after drying is expressed as percentage points. The percentage points of water removed is correlated to mass of water removed per unit of crop, using the following regression Equation 1 below. It was determined to use one regression equation for most of the listed crops, except wheat.
\[ m_{water\ per\ unit} = 0.0113483 \times \Delta_{M} + 0.0001711 \times {\Delta_{M}}^2 \tag{1}\]
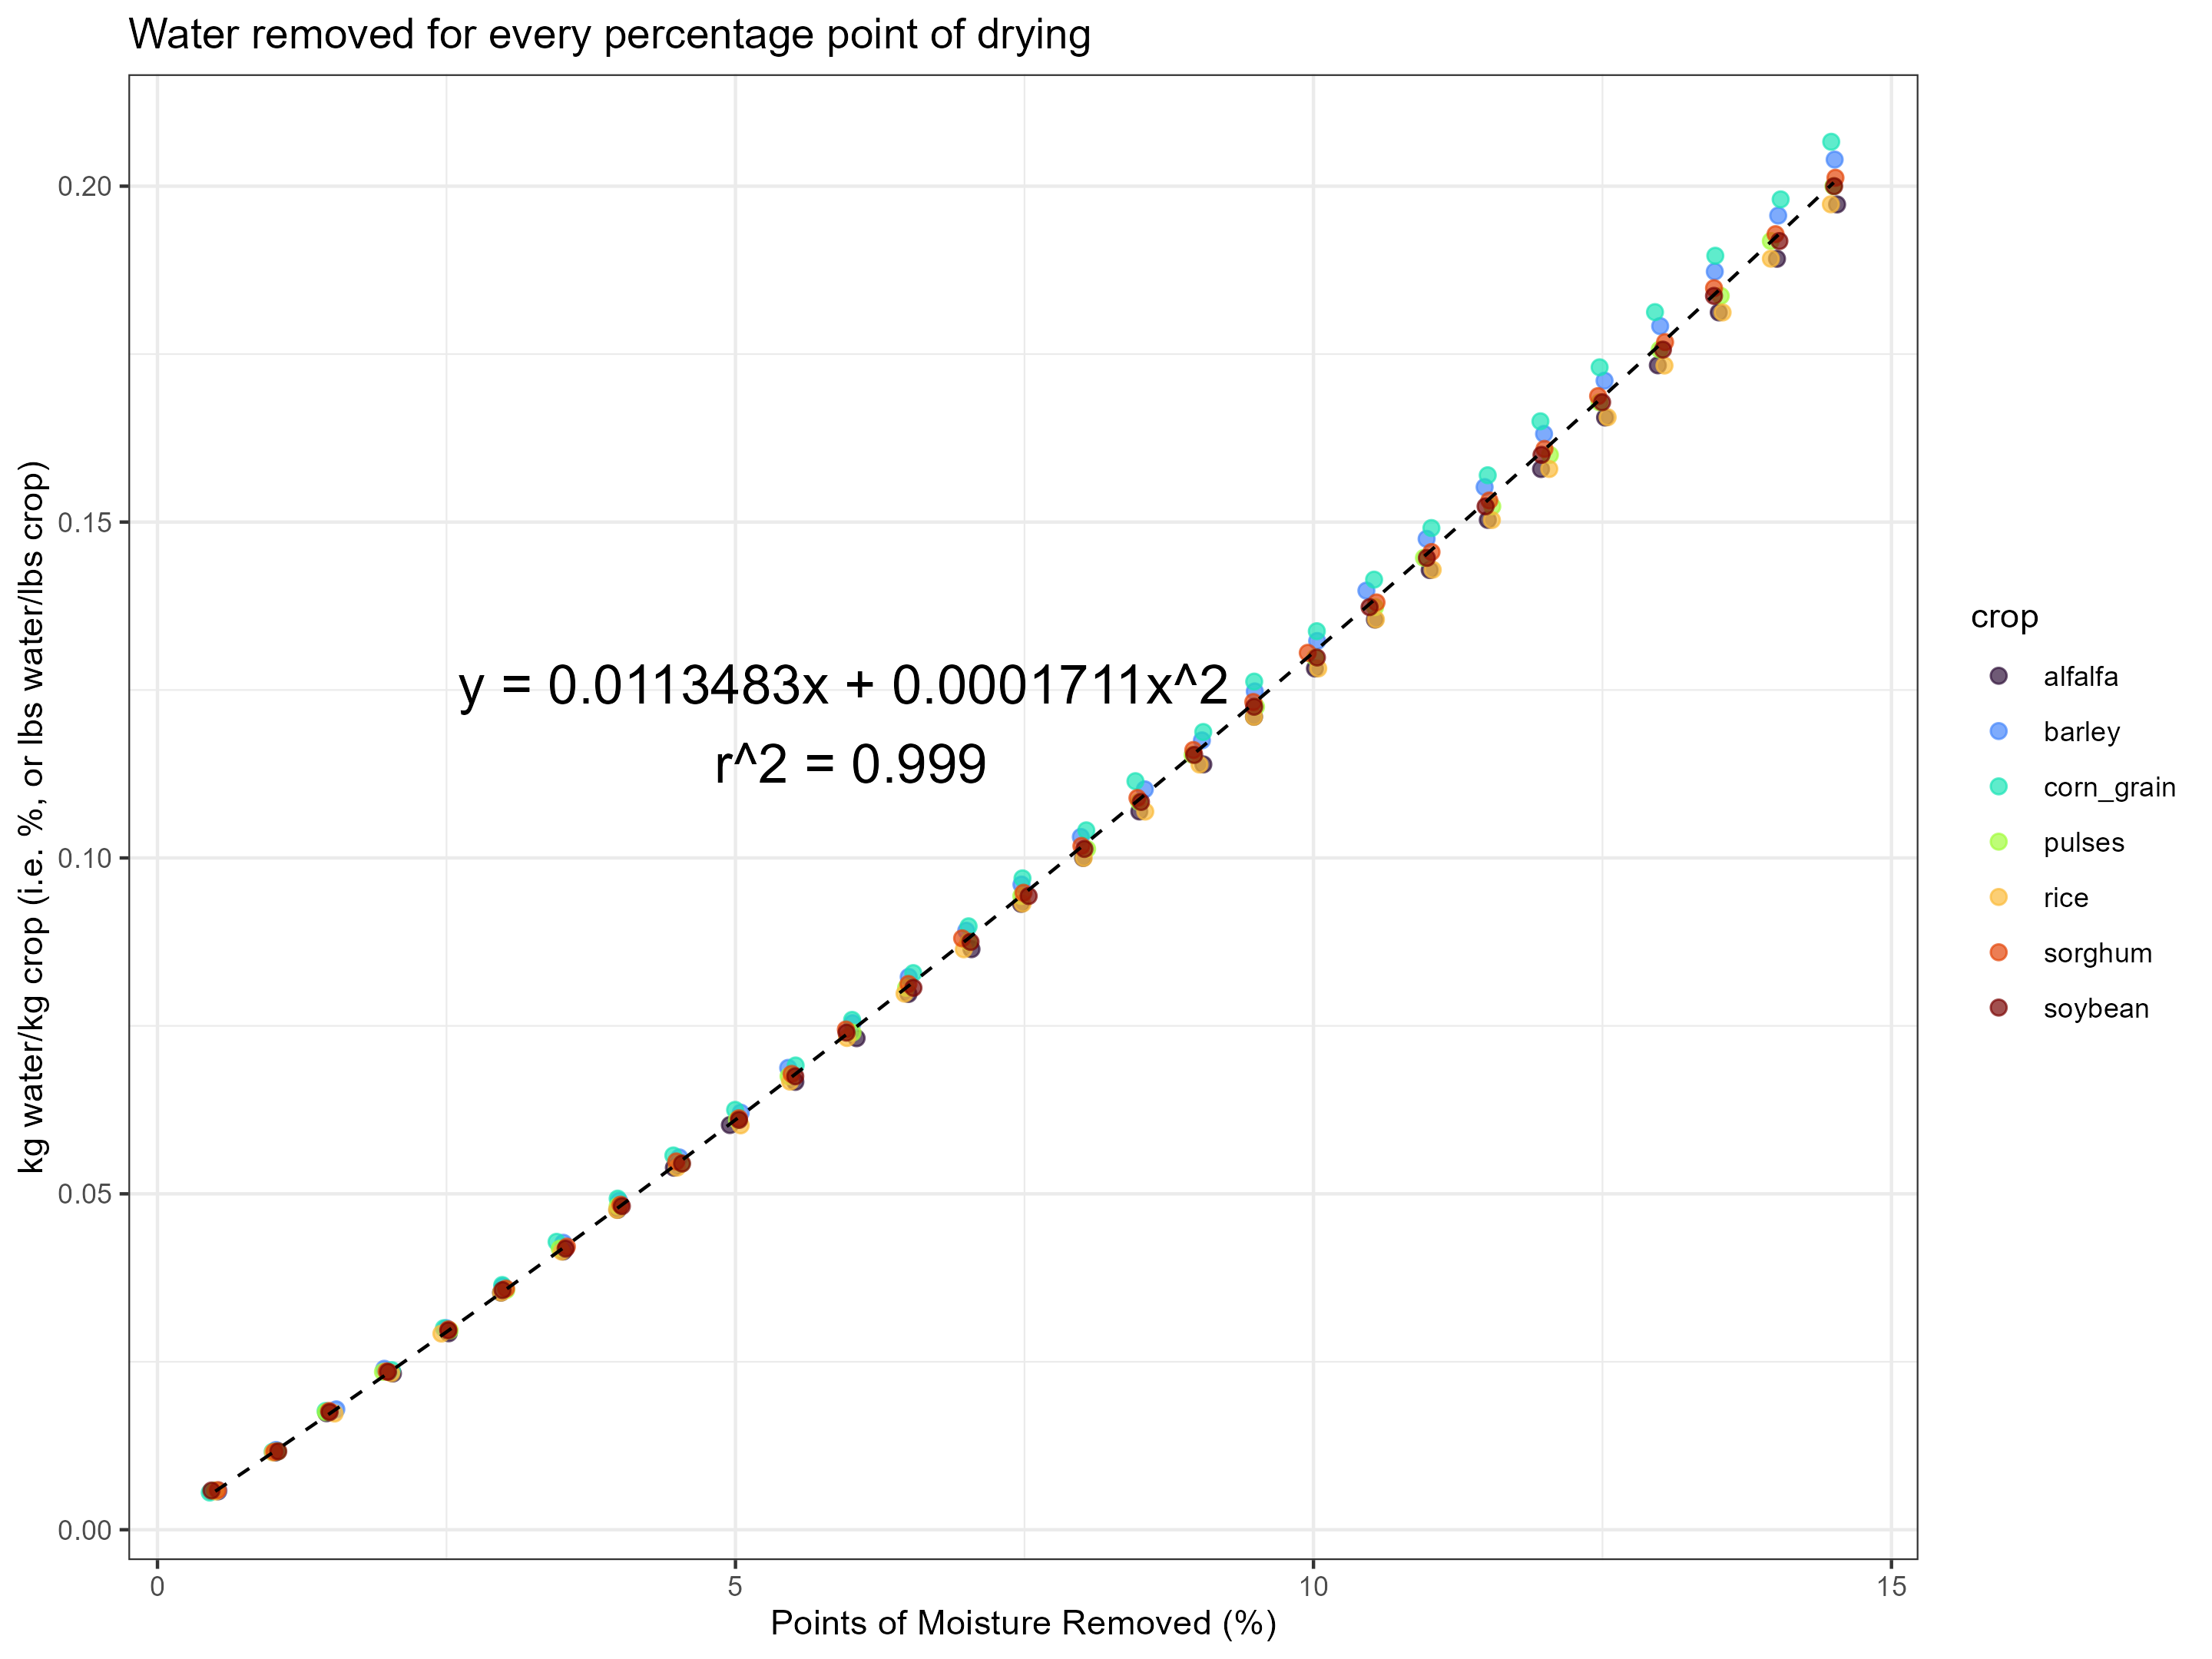
For example, if you dry a corn grain crop from 20% moisture to 16% moisture (4% points), we estimate 0.0841 kg of water were removed per kg of corn dried. Multiplying this by the total production of the field (keep same units) gives the total amount of water removed through drying, for that field.
The user indicates what drying system was used based on the options in Table 6. Each option has an associated energy footprint for gas and electricity meaning that, in addition to the total drying energy for the field, the GHG emissions associated with the gas and electric can be calculated later on. Of course, any of the these results can be divided by crop production or field area to calculate efficiency metrics.
One source states that
the Propane Education and Research Council (PERC) estimates that about 80 percent of grain dryers in the U.S. use propane.
Wheat
From Ford (2024)
In-bin wheat drying processes can utilize either natural air (unheated) or low temperature air (slightly heated usually less than 10 °F) to dry grain in bins (see figure 1). The air is forced up through the grain with fans until the grain moisture content is sufficiently reduced.
High temperature batch or continuous flow dryers are usually used to dry large capacities of wheat. These units typically have very high airflow rates, and they do not require supplemental heat for daytime drying when harvesting wheat at 18-20% moisture range.
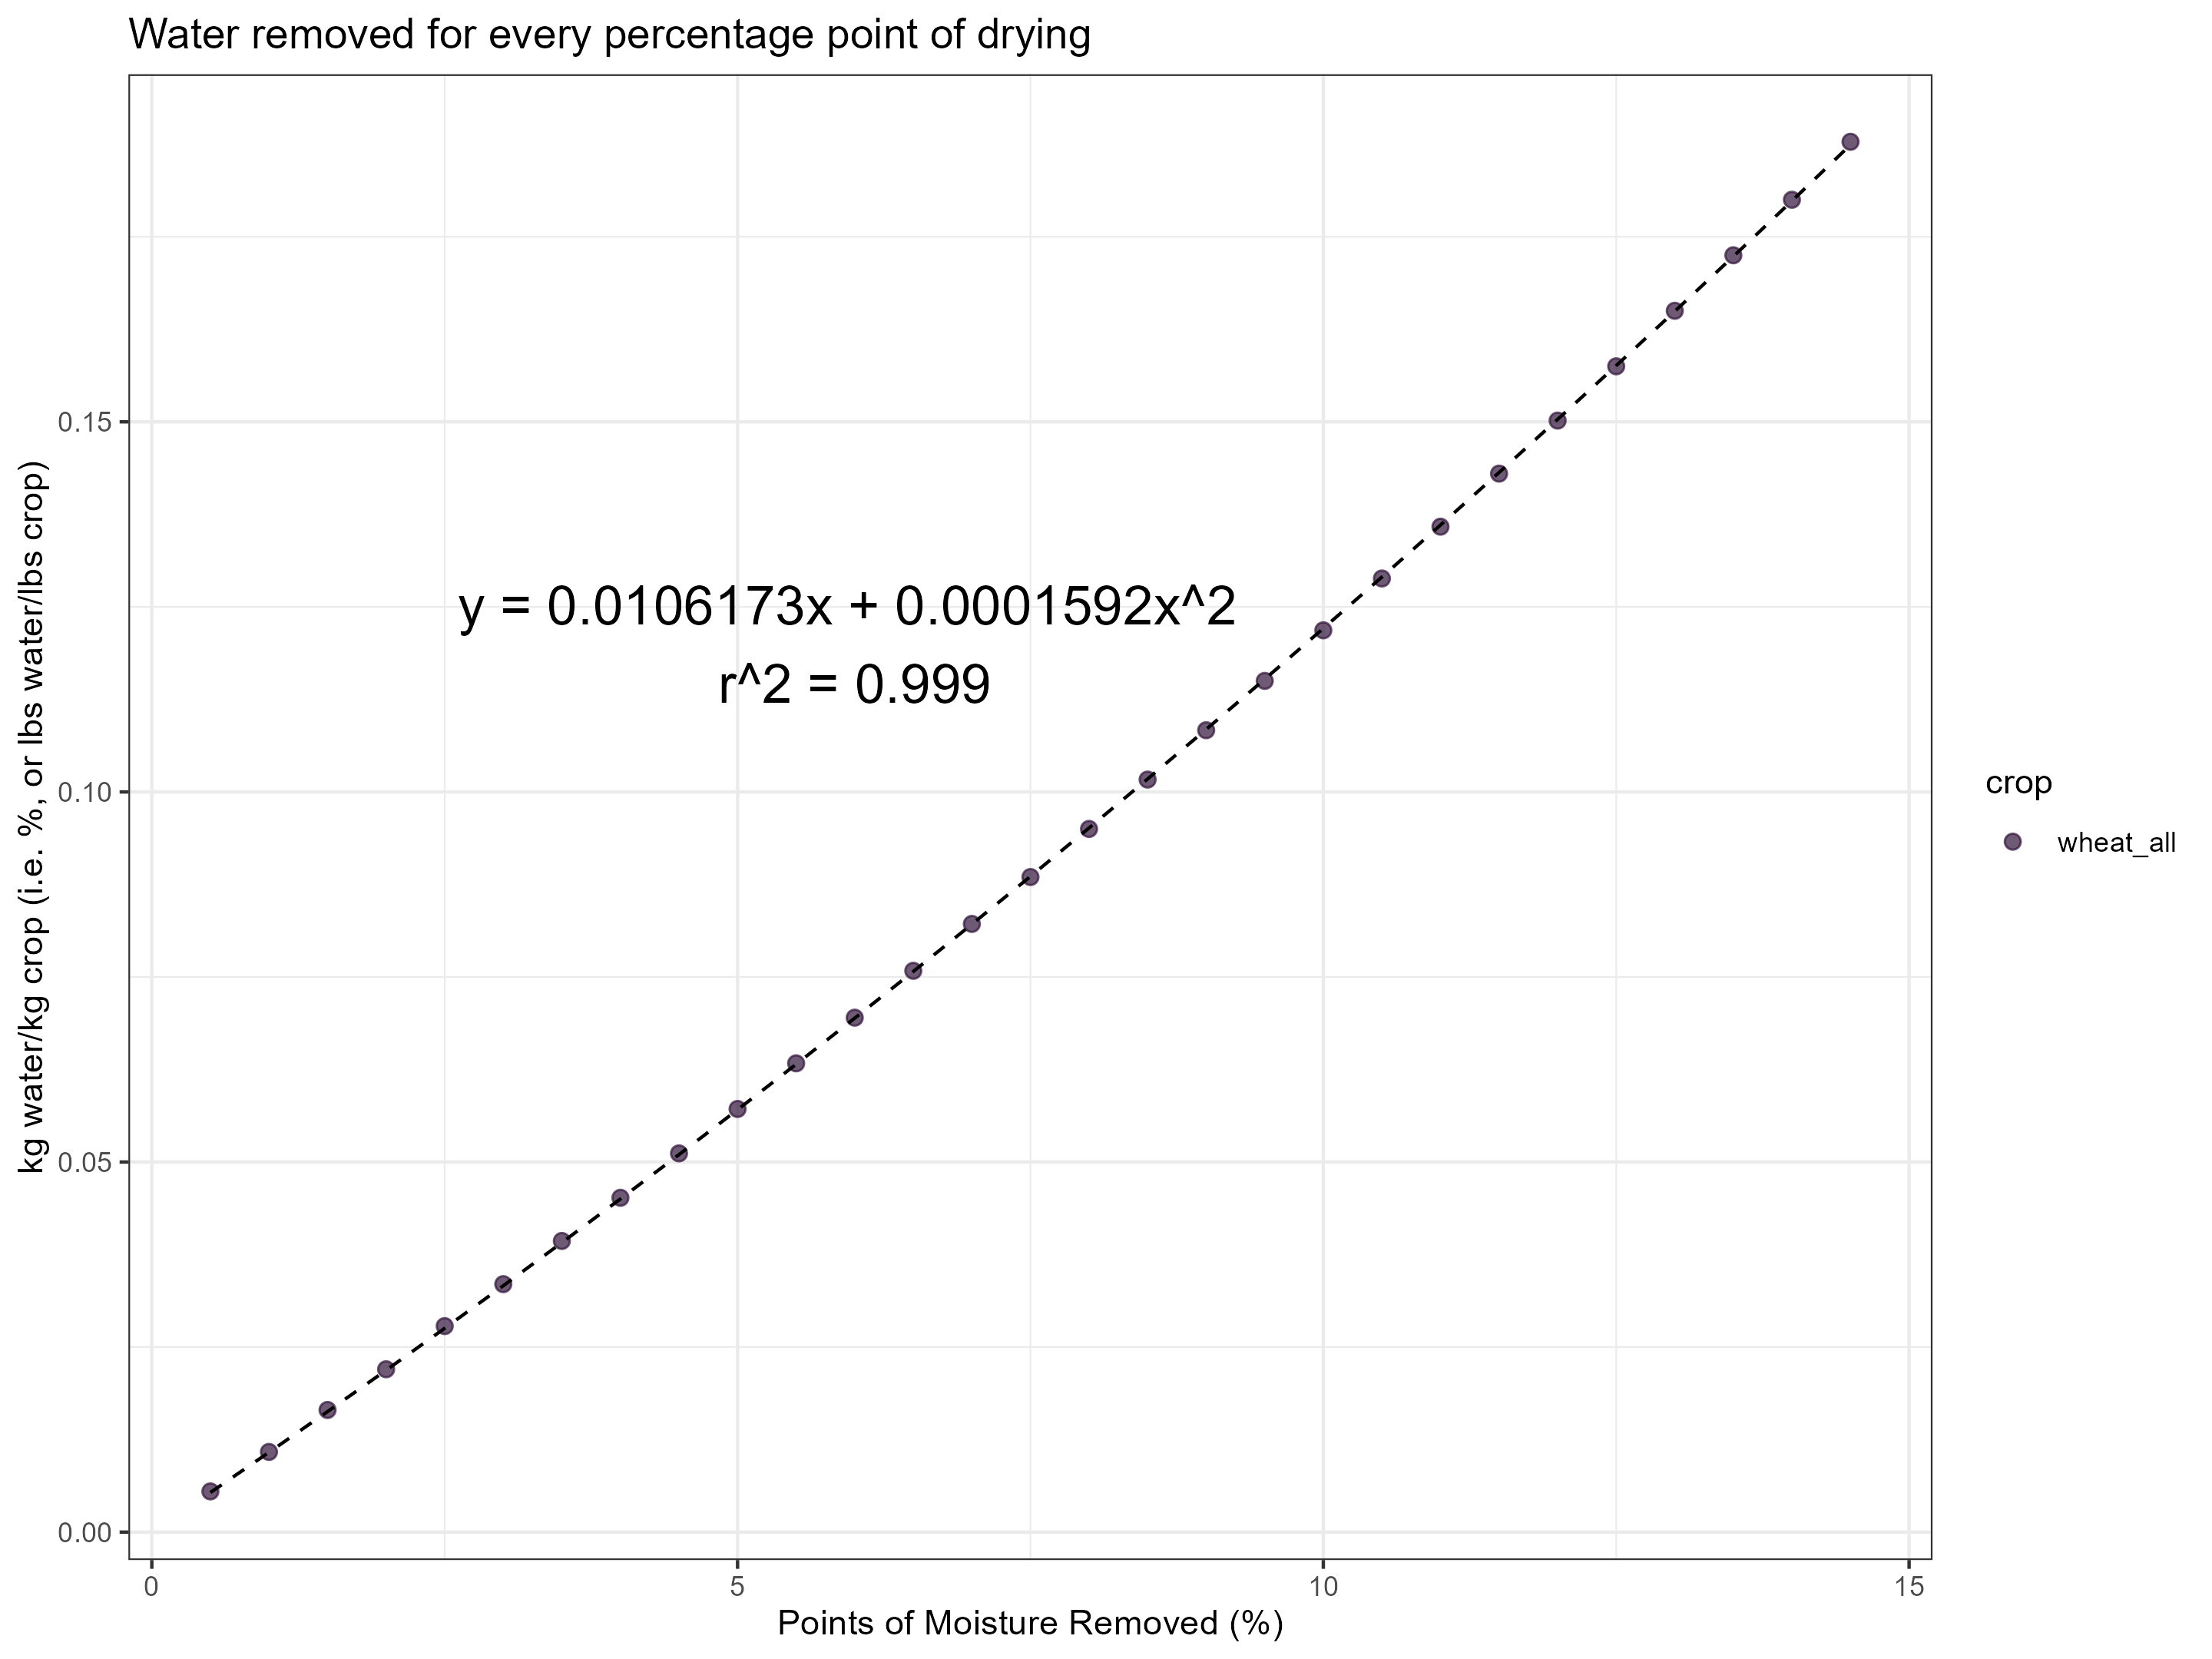
In previous metric versions, wheat had slightly lower values for water removed. Keeping with this and in agreement with values in Ford (2024), wheat will have its own drying formula and generic drying option in the Table 6.
\[ m_{water\ per\ unit} = 0.0106173 \times \Delta_{M} + 0.0001592 \times {\Delta_{M}}^2 \tag{2}\]
Inputs
| Input | Value | Units | Symbol |
|---|---|---|---|
| Crop yield (standardized) | User entry | kg/ac | \(Y_{s}\) |
| Field area | User defined boundary | acre | \(A\) |
| Points of moisture removed | Difference between initial moisture content and final moisture after drying | percentage (0 - 100%) |
\(\Delta_{M}\) |
| Drying system options and energy use | See Table 6 | MJ kg-1 water removed | \(e_{gas}\) \(e_{electric}\) |
| Energy and emission factors | Table 7 |
Steps
The following should be in harmony with the logic described in the Crop Transportation page.
Was the crop was dried using energy?
- If not, as in the case of natural air drying, energy and emissions are zero.
Where was the crop dried?
If the crop was dried using an on-farm system, ask What type of drying system was used?
If the crop was dried off-farm, the Calculator automatically selects a Commercial Drying system
- The energy factors for this default are a reasonable “average” across drying systems, including the alfalfa options.
Where the crop was dried and stored affects the system boundary (see logic)
How much moisture was removed by drying?
Using the points of moisture removed1, calculate the amount of water removed per kg of crop using either Equation 1 or Equation 2.
Calculate the total amount of water removed (kg) by multiplying the Step 2 result by total crop transported (kg).
Using the thermal efficiency values from Table 6, multiply the amount of water removed by the MJ values for the gas and electric components.
Convert MJ of gas to quantity units, and convert electricity from MJ to MWh.
Multiply the quantities of gas and electricity by their respective emission factors.
1 There should be a warning if the entered value for the total moisture removed is greater than 15% points. This warning will not stop the calculation unless total moisture exceeds 30%.
Formulas
\[ m_{water} = m_{water\ per\ unit} \times Y_s \ A \]
\[ E_{gas} = m_{water} \times e_{gas} \]
\[ E_{electric} = m_{water} \times e_{electric} \]
\[ E_{drying} = E_{gas} + E_{electric} \]
Example for most grain crops
A 100-acre field produced 65 bu/ac of soybean which was dried on-farm by 2 moisture points. Their farm is in the Midwest, in the SRMW eGrid subregion.
NoteTotal emissions for both electric and gas components of drying soybeans
1,227 kg CO2e
| system_boundary | source_category | drying_system | CO2_fossil | CO2_biogenic | CH4_fossil | CH4_biogenic | N2O | NF3 | SF6 | units |
|---|---|---|---|---|---|---|---|---|---|---|
| Upstream | production of fuels | Combination High/Low Temp Bin | 91.1 | 0 | 7.58 | 0 | 0.415 | NA | NA | kg_CO2e |
| On-Farm Mechanical | stationary machinery | Combination High/Low Temp Bin | 563 | 0 | 0.815 | 0 | 1.49 | NA | NA | kg_CO2e |
| Upstream | electricity generation and distribution | Combination High/Low Temp Bin | 544 | NA | 15.5 | 0.0213 | 2.45 | 0.0000136 | 0.00532 | kg_CO2e |
Alfalfa
The drying energy for alfalfa is calculated for each cutting. The sum of the cuttings represents the total drying energy. The harvest moisture value entered by the user in the Calculator represents the percent moisture content after baling, as the bales will be transported and possibly loaded into a forced-air drying system.
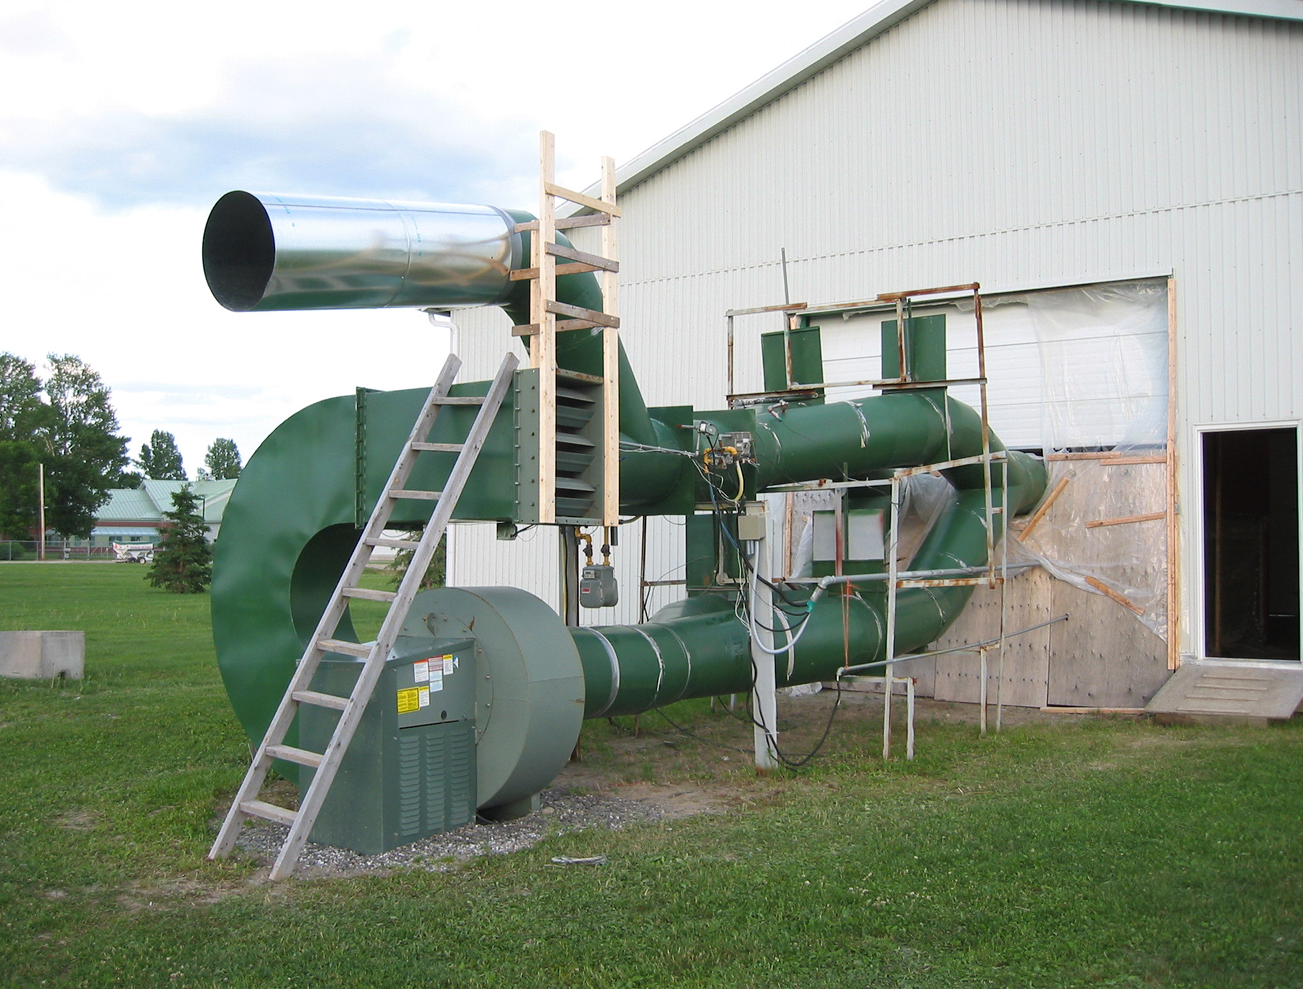
As discussed in the first section above on grain crops, the following regression also describes drying for alfalfa.
Inputs
| Input | Value | Units | Symbol |
|---|---|---|---|
| Crop yield | User entry | ton | \(Y\) |
| Field area | User defined boundary | acre | \(A\) |
| Harvest moisture (after baling) | User entry | Percentage (0 - 100%) |
\(M\) |
| Final moisture | 12 (standard moisture in the Platform) | Percentage (0 - 100%) |
\(M_s\) |
| Points of moisture removed | Difference between harvest moisture content and final moisture after drying; default = 18% | percentage (0 - 100%) |
\(\Delta_{M}\) |
| Hay drying system | Two hay dryer options in |
Table
Parker et al. (1992) reported 142 kg water removed per tonne of alfalfa to remove 11.9% moisture. Using our regression, we would expect about 151 kg water removed per tonne to remove 11.9% moisture, meaning our formula is reasonably within 10% of a real data point. Parker et al. (1992) also gave numbers for energy use in forced drying hay (standardized to 18% moisture content):
Fan: 100-150 kWh tonne-1; 1.05 kWh/kg water removed (3.78 MJ kg-1)
Fan + LP Gas: 300-600 kWh tonne-1; ~1.5 kWh/kg water removed (5.4 MJ kg-1)
Arinze et al. (1996) reported a specific energy consumption around 2060 BTU/lb-water removed, which is in agreement with our table of drying systems and their associated energy.
Two options for alfalfa have been added to Table 6.
Formulas
\[ m_{water} = m_{water\ per\ unit} \times Y_s \ A \]
\[ E_{gas} = m_{water} \times e_{gas} \]
\[ E_{electric} = m_{water} \times e_{electric} \]
\[ E_{drying} = E_{gas} + E_{electric} \]
where \(m_{water}\) is the mass of water removed. This is multiplied by the energy per unit of water removed
\[ E_{drying} = m_{water} \times E_{system} \times Y_s \ A \]
Steps
- Was the crop was dried using energy?
- If not, as in the case of natural air drying, energy and emissions are zero.
- Where was the crop dried?
If the crop was dried using an on-farm system, ask What type of drying system was used?
If the crop was dried off-farm, the Calculator automatically selects a Hay Dryer With Gas Heating system
Where the crop was dried and stored affects the system boundary (see logic)
- How much moisture was removed by drying?
- Using the points of moisture removed2, calculate the amount of water removed per kg of crop using Equation 1.
- Calculate the total amount of water removed (kg) by multiplying the Step 2 result by total crop transported (kg).
- Using the thermal efficiency values from Table 6, multiply the amount of water removed by the values for the gas and electric components.
- Convert MJ of gas to quantity units, and convert electricity from MJ to MWh.
- Multiply the quantities of gas and electricity by their respective emission factors.
2 There should be a warning if the entered value for the total moisture removed is greater than 15% points.
Example
Let’s say 7 ton/ac of alfalfa was harvested3 from an 100 acre field located in the SRMW grid region. The initial moisture was 22%. The crop was baled and dried off-farm in a gas-heated, forced-air system. How much energy was used during this post-harvest process?
3 The drying energy are calculated separately for each cutting, but for simplicity in this example, cuttings are combined.
NoteTotal energy used for both electric and gas components of drying alfalfa
909,444 MJ
| system_boundary | source_category | drying_system | MJ | units |
|---|---|---|---|---|
| Upstream | production of fuels | Hay Dryer With Gas Heating | 35400 | MJ |
| Post-Harvest | stationary machinery | Hay Dryer With Gas Heating | 248000 | MJ |
| Upstream | electricity generation and distribution | Hay Dryer With Gas Heating | 626000 | MJ |
Cotton
In the case of cotton, where lint drying occurs at the gin and is not in direct control of the grower, the user is asked to qualitatively assess the moisture content of their cotton crop upon delivery to the gin. Based on this qualitative grouping, the energy used for drying and ginning are found in a lookup table developed by Dr. Ed Barnes, Senior Director Agricultural & Environmental Research, Cotton Incorporated.
In the case of cotton, the energy use and GHG emissions associated with post-harvest processing like ginning and drying are assigned to the Upstream and On-Farm Mechanical system boundaries (as with cotton crop transportation).
Inputs
| Input | Value | Units | Symbol |
|---|---|---|---|
| Crop yield (standardized) | User entry | lbs lint | \(Y_{s}\) |
| Field area | User defined boundary | acre | \(A\) |
| Moisture content | User selection from 4 choices in Table 3 | qualitative |
| cotton_region | cotton_moisture_level | cotton_gas_source | gas_mj_per_kg_lint | electric_mj_per_kg_lint |
|---|---|---|---|---|
| SE | Very Dry | LPG | 0.209 | 0.705 |
| SE | Normal | LPG | 0.628 | 0.751 |
| SE | Wetter than Normal | LPG | 1.05 | 0.798 |
| SE | Very Wet | LPG | 1.47 | 0.844 |
| SW | Very Dry | Natural gas | 0.209 | 0.705 |
| SW | Normal | Natural gas | 0.628 | 0.751 |
| SW | Wetter than Normal | Natural gas | 1.05 | 0.798 |
| SW | Very Wet | Natural gas | 1.47 | 0.844 |
Formula
\[ E_{postharvest} = Y_s\ A\ (E_{drying} + E_{ginning}) \]
Example
A cotton grower in Georgia (eGrid subregion SRSO) harvested 1200 lb-lint per acre on a 100 acre field. She estimated the moisture content was wetter than normal. What emissions are associated with drying and ginning her cotton crop?
NoteTotal emissions for ginning and drying cotton
9,755 kg CO2e
| system_boundary | source_category | drying_system | CO2_fossil | CO2_biogenic | CH4_fossil | CH4_biogenic | N2O | NF3 | SF6 | units |
|---|---|---|---|---|---|---|---|---|---|---|
| Upstream | production of fuels | Commercially Dried | 586 | 0 | 48.7 | 0 | 2.67 | NA | NA | kg_CO2e |
| On-Farm Mechanical | stationary machinery | Commercially Dried | 3620 | 0 | 5.24 | 0 | 9.6 | NA | NA | kg_CO2e |
| Upstream | electricity generation and distribution | Commercially Dried | 5270 | NA | 196 | 1.56 | 17.9 | 0.000321 | 0.000401 | kg_CO2e |
Peanuts
For peanuts, drying energy is calculated using a set of equations developed by staff at USDA ARS in Georgia, which are based on empirical data and previous research (Blankenship and Chew 1979). The peanut drying energy considers energy for electric fans (kWh ton-1) blowing air past a gas burner (BTU ton-1).
Inputs
| Input | Value | Units | Symbol |
|---|---|---|---|
| Crop yield (standardized) | User entry | ton | \(Y_{s}\) |
| Field area | User defined boundary | acre | \(A\) |
| Initial moisture content | User entry | percentage (0 - 100%) |
\(M\) |
Formula
The original equations were given in units of BTU ton-1 and kWh ton-1.
\[ E_{gas} = 62618\ M - 578344 \]
\[ E_{electric} = 2.991\ M - 27.7 \]
\[ E_{postharvest} = Y_s\ A\ (E_{gas} + E_{electric}) \tag{3}\]
Important
The results for gas and electric energy are each converted into BTU lb-1 before proceeding to Equation 3.
Example
The grower harvested 4700 lbs/ac of peanuts from an 100 acre field in southern Georgia (eGrid subregion SRSO). The peanuts were delivered to the curing facility with an initial moisture content upon arrival of 16%. Provide an energy and emissions table.
| scn_id | state | crop | metric | system_boundary | source_category | source_detail | CO2_fossil | CH4_fossil | CH4_biogenic | N2O | NF3 | SF6 | MJ | units |
|---|---|---|---|---|---|---|---|---|---|---|---|---|---|---|
| 44 | Georgia | Peanuts | Energy Use | Upstream | production of fuels | Crop Drying | LPG | 0 | 0 | 0 | 0 | NA | NA | 16300 | MJ |
| 44 | Georgia | Peanuts | Energy Use | Post-Harvest | stationary machinery | Crop Drying | LPG | 0 | 0 | 0 | 0 | NA | NA | 114000 | MJ |
| 44 | Georgia | Peanuts | Energy Use | Upstream | electricity generation and distribution | Crop Drying | Electricity (grid) | 0 | 0 | 0 | 0 | 0 | 0 | 116000 | MJ |
| 44 | Georgia | Peanuts | GHG Emissions | Upstream | production of fuels | Crop Drying | LPG | 1170 | 97.3 | 0 | 5.33 | NA | NA | 0 | kg_CO2e |
| 44 | Georgia | Peanuts | GHG Emissions | Post-Harvest | stationary machinery | Crop Drying | LPG | 7220 | 10.5 | 0 | 19.2 | NA | NA | 0 | kg_CO2e |
| 44 | Georgia | Peanuts | GHG Emissions | Upstream | electricity generation and distribution | Crop Drying | Electricity (grid) | 2240 | 83.4 | 0.665 | 7.62 | 0.000137 | 0.000171 | 0 | kg_CO2e |
Corn Silage, Potatoes, and Sugar Beets
Corn silage, potatoes, and sugar beets do not yet have energy associated with post-harvest processing activities like storage and drying. While corn silage may be wrapped and/or stored, and potatoes have energy associated with storage and refrigeration, the associated energy is not fully accounted for currently in version 5.0 of the Fieldprint Calculator. Only the energy to transport the crop from the field to the storage is accounted.
Field to Market would welcome collaborations to include these components in a future release of the Platform.
Tables
Drying System Options
| drying_system | gas_mj_per_kg_water | electric_mj_per_kg_water |
|---|---|---|
| Natural Air Only | 0 | 0 |
| No Heat Bin | 0 | 3.49 |
| Low Temp Bin | 0 | 3.84 |
| Combination High/Low Temp Bin | 2.09 | 0.698 |
| Continuous/Mixed Flow In Bin | 4.56 | 0.0931 |
| High Temp Batch Dryer | 5.47 | 0.112 |
| PTO-driven Batch Dryer | 7.3 | 0.149 |
| Continuous Cross Flow Dryer | 7.3 | 0.149 |
| Hay Dryer Without Gas Heating | 0 | 3.72 |
| Hay Dryer With Gas Heating | 3.84 | 1.28 |
| Commercially Dried | 4.56 | 0.0931 |
Energy and Emission Factors
| metric | system_boundary | source_category | source_detail | subregion | CO2_fossil | CO2_biogenic | CH4_fossil | CH4_biogenic | N2O | NF3 | SF6 | MJ |
|---|---|---|---|---|---|---|---|---|---|---|---|---|
| GHG Emissions | Upstream | GHG emissions associated with production of fuels | Crop Drying | Diesel (ag equipment) | NA | 0.975 | 0 | 0.00233 | 0 | 0.0000195 | NA | NA | 0 |
| GHG Emissions | Upstream | GHG emissions associated with production of fuels | Crop Drying | Gasoline | NA | 1.68 | 0 | 0.00468 | 0 | 0.000323 | NA | NA | 0 |
| GHG Emissions | Upstream | GHG emissions associated with production of fuels | Crop Drying | LPG | NA | 0.914 | 0 | 0.00255 | 0 | 0.0000152 | NA | NA | 0 |
| GHG Emissions | Upstream | GHG emissions associated with production of fuels | Crop Drying | Natural gas | NA | 0.00614 | 0 | 0.000195 | 0 | 0.00000131 | NA | NA | 0 |
References
Arinze, E. A., S. Sokhansanj, G. J. Schoenau, and F. G. Trauttmansdorff. 1996. “Experimental Evaluation, Simulation and Optimization of a Commercial Heated-Air Batch Hay Drier: Part 1, Drier Functional Performance, Product Quality, and Economic Analysis of Drying.” Journal of Agricultural Engineering Research 63 (4): 301–14. https://doi.org/10.1006/jaer.1996.0033.
Blankenship, Paul D., and Victor Chew. 1979. “Peanut Drying Energy Consumption.” Peanut Science 6 (1): 10–13. https://doi.org/10.3146/i0095-3679-6-1-3.
Ford, Vic. 2024. Wheat Drying and Storage. https://www.uaex.uada.edu/farm-ranch/crops-commercial-horticulture/Grain_drying_and_storage/wheat_drying_and_storage.aspx.
Panigrahi, Shubham Subrot, Kaushik Luthra, Chandra B. Singh, Griffith Atungulu, and Kenny Corscadden. 2023. “On-Farm Grain Drying System Sustainability: Current Energy and Carbon Footprint Assessment with Potential Reform Measures.” Sustainable Energy Technologies and Assessments 60 (December): 103430. https://doi.org/10.1016/j.seta.2023.103430.
Parker, BF, GM White, MR Lindley, et al. 1992. “Forced-Air Drying of Baled Alfalfa Hay.” Transactions of the ASAE 35 (2): 607–15.
Savoie, P, and H Joannis. 2006. “Bidirectional Drying of Baled Hay with Air Recirculation and Cooling.” Canadian Biosystems Engineering 48: 3. https://library.csbe-scgab.ca/docs/journal/48/c0614.pdf.