| Crop | Crop Production Unit (USCS) | lb / USCS unit | Production Output |
|---|---|---|---|
| Alfalfa | ton | 2000 | Forage or Biomass |
| Barley | bushel | 48 | Grain or seed |
| Chickpeas (garbanzos) | lb | 1 | Grain or seed |
| Corn (grain) | bushel | 56 | Grain or seed |
| Corn (silage) | ton | 2000 | Forage or Biomass |
| Cotton | lb | 1 | Lint |
| Dry Beans | lb | 60 | Grain or seed |
| Dry Peas | lb | 60 | Grain or seed |
| Fava Beans | lb | 1 | Grain or seed |
| Lentils | lb | 1 | Grain or seed |
| Lupin | lb | 1 | Grain or seed |
| Peanuts | lb | 1 | Grain or seed |
| Potatoes | cwt | 100 | Tuber |
| Rice | cwt | 100 | Grain or seed |
| Sorghum | bushel | 56 | Grain or seed |
| Soybeans | bushel | 60 | Grain or seed |
| Sugar beets | ton sugar | 2000 | Root |
| Wheat (durum) | bushel | 60 | Grain or seed |
| Wheat (spring) | bushel | 60 | Grain or seed |
| Wheat (winter) | bushel | 60 | Grain or seed |
Supplementary Material
Commonly requested data, tables, and additional information to the methods documentation.
Crops included in the Fieldprint Platform
Fieldprint Calculator User Inputs
Important
The Fieldprint Platform expects primary, field-level data from farmers about crop production activities. Some user inputs are pre-filled with reasonable default data. Growers are encouraged to review and correct pre-filled information to improve the accuracy of their results.
User inputs include the following:
Field boundaries for the planted area.
Sequence of crops planted, including cover cropping, double cropping, fallow years, and crop failures.
When growers draw a field boundary in the Platform, the system pre-fills the sequence of cash crops from 2008 to the latest available years as detected by the USDA Cropland Data Layer (CDL) (Boryan et al. 2011)
- Growers are encouraged to review and correct the pre-filled information.
The Cropland Data Layer currently provides detection of cash crops, fallow years, and most double crops; it does not provide detection of cover cropping, crop failures, and triple or quadruple cropping. Depending on the timing of data entry, growers will need to indicate the latest crop produced as the CDL annual release occurs several months after the harvest season closes for summer cash crops.
Crop production1 output (e.g. yield) for each field, on the basis of planted area.
Fertilizer types and rates.
Irrigation activities, which include: the gross amount of irrigation water pumped, pumping depth and pressure, and the source of energy for the pump.
Addition of other organic amendments (e.g., compost, bio-solids).
Number of pesticide products applied.
- Field to Market produces assumptions of pesticide rates by category (e.g. herbicide, insecticide) for each crop. For more information, see pesticide rates.
All field activities: plant, harvest, tillage, residue management, nutrient and pesticide applications, and cover cropping.
- Field to Market provides a comprehensive list of field operations to closely match the agricultural equipment used by growers based on the Conservation Resources Land Management Operations Database (CRLMOD) (Kucera and Coreil 2023).
Transportation distance of crop production outputs from the field to the next step (drying or storage by grower or purchaser).
Amount of moisture removed by drying activities, and characteristics of the drying system.
Seeding rate.
- This input has minimal impact on the outcome of the analysis, and Field to Market pre-fills the seeding rate based on available literature data.
- Growers can review and change it.
1 In the future, users will be able to indicate if there was a crop failure.
How Inputs are Connected to the Sustainability Indicators
The Concept of Crop Intervals
A crop interval is defined as the period between two dates in which on-farm and field activities are conducted to produce a cash crop. Defining a crop interval is critical to creating a well-defined and continuous sequence of crop management activities for a given field.
A crop interval starts after the last day of harvest of the previous cash crop and ends with the harvest of the next cash crop. Crop drying is included in the crop interval regardless of when the drying operation is conducted. A crop interval might start on the same day of harvest when there is a field operation on that day (stalk shredding, tillage, etc.); otherwise, the crop interval starts on the day after harvest. The energy use and GHG emissions associated with on-farm and field activities that occur during the crop interval are attributed to the cash crop being produced. Crop intervals typically straddle calendar years; however, there are some exceptions, such as short-season double-crops. Crop intervals are named using the crop name and harvest year or month-year of harvest. For example, a crop interval for cotton harvested in 2023 would be named 2023 cotton or 2023-10 cotton to specify that it was harvested in October of 2023. The month-harvest designation will only be used when there are two crop harvests of the same crop in one calendar year.
To close a crop interval, the crop must result in economic gain. Economic gain is defined as crop harvest, either with machinery (grain, forage removal) or consumed by livestock on-site. Fallow years, crop failures, and crop abandonment require specific treatment; these scenarios are discussed in the sections below.
Growing a cover crop for soil cover, green manure, or other soil health benefits does not count as economic gain to define a crop interval. The energy use and GHG emissions associated with cover cropping activities are attributed to the following cash crop.
Below, we include eight scenarios to illustrate the concept of crop intervals. To be concise, we show a simplified list of field activities, omitting crop transportation, drying, and irrigation events, along with other operations.
Case 1: One cash crop per season
In the simplest case, a crop interval starts after the harvest of the previous cash crop and ends with the harvest of the following cash crop.
The following figure demonstrates the crop intervals for a corn-soybean rotation.
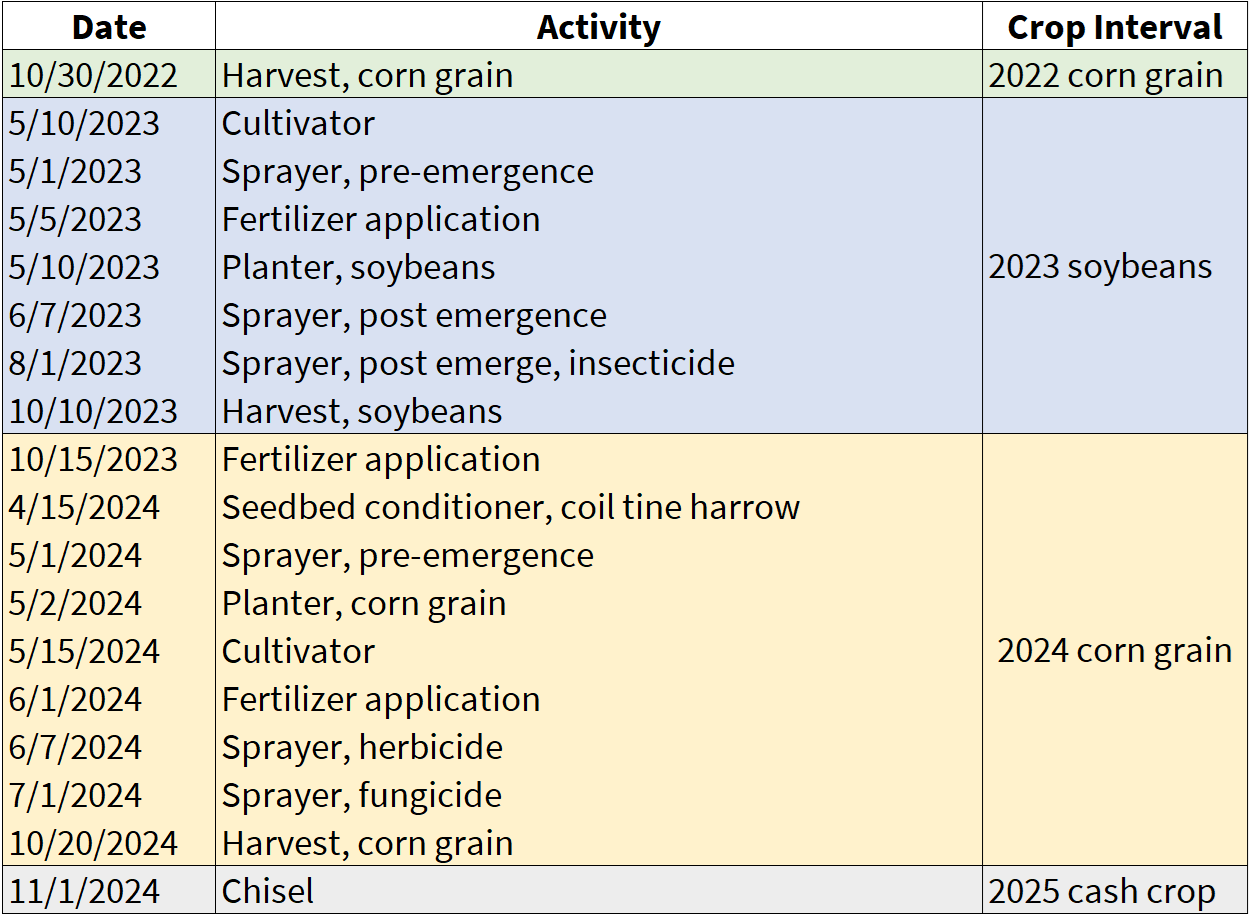
In Case 1, the energy use and GHG emissions associated with the field activities after the harvest of the 2022 corn grain are attributed to the 2023 soybean crop, the energy use and GHG emissions associated with the activities after harvest of soybeans are attributed to the 2024 corn crop, and so on. For the two crops with complete information shown above, the crop intervals would be delineated as follows:
2023 soybeans, 10-31-2022 to 10-10-2023
2024 corn grain, 10-11-2023 to 10-20-2024
Case 2: Rotation with double-cropping
In many regions of the US, growers can add a second, short-season crop to their rotations. A common double-crop rotation is producing soybeans after a winter wheat harvest.
The following figure demonstrates the crop intervals for a rotation with double-cropping.
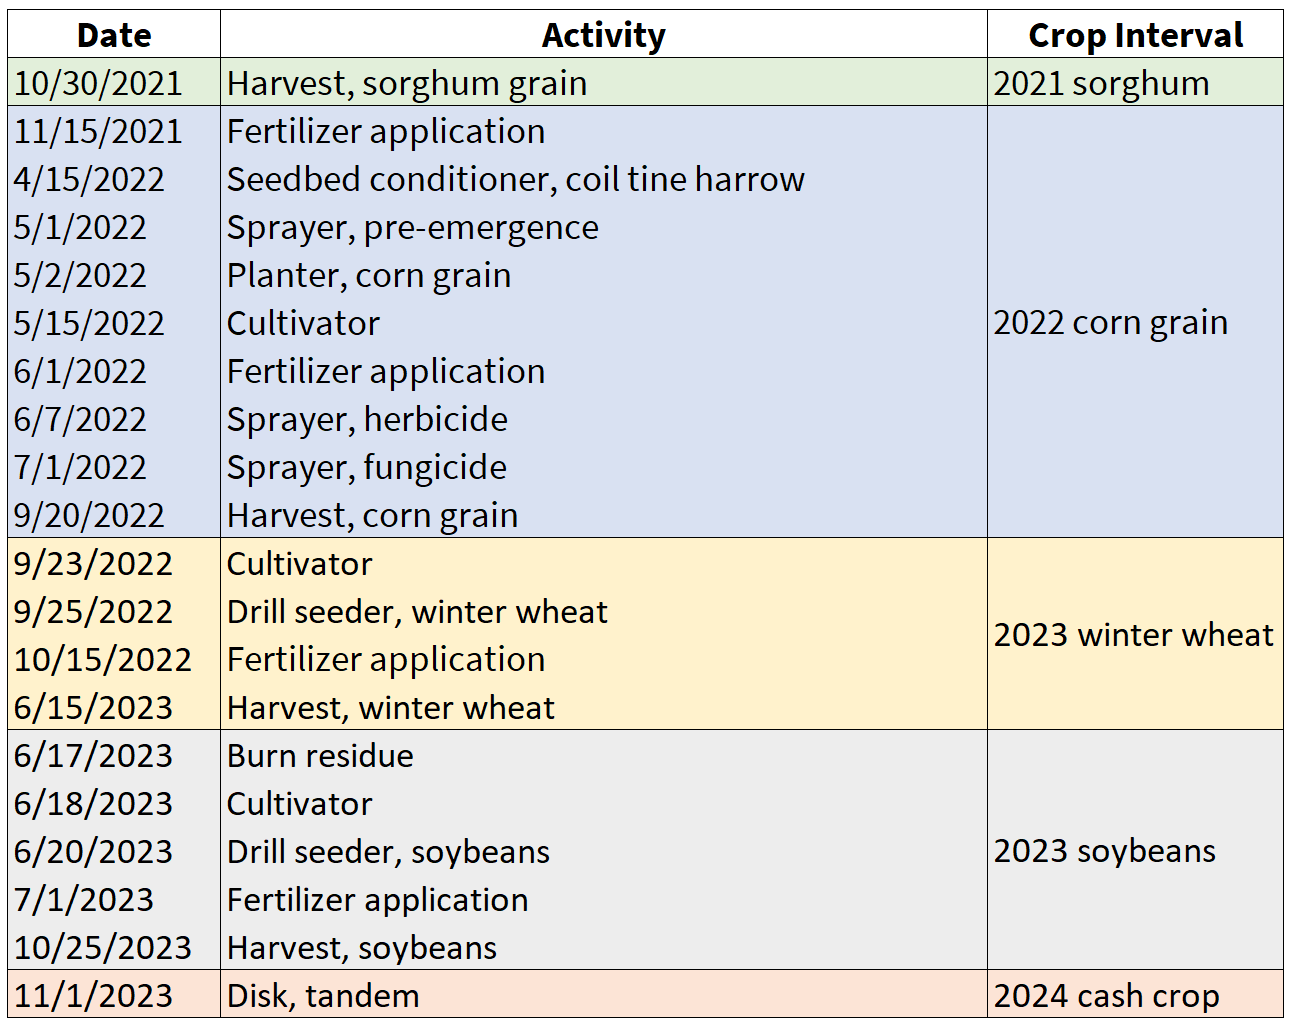
In this rotation, the 2023 soybeans have a short crop interval that lasts around four months without straddling a calendar year. For the crops with complete information shown above, the crop intervals would be delineated as follows:
2022 corn grain: 10/31/2021 to 9/20/2022
2023 winter wheat: 9/21/2022 to 6/15/2023
2023 soybeans: 6/16/2023 to 10/15/2023
The energy use and GHG emissions associated with the on-farm and field activities within the dates of the crop interval are attributed to the cash crop named in the crop interval.
Case 3: Grower produces a cash crop per year and adds cover cropping
In this case, a grower introduces cover crops to the rotation while harvesting one cash crop per year. The cover cropping activities (planting, seed inputs, chemical or mechanical termination, etc.) are included in the crop interval for the cash crop.
The following figure demonstrates the crop intervals for a rotation with cash crops and cover crops.
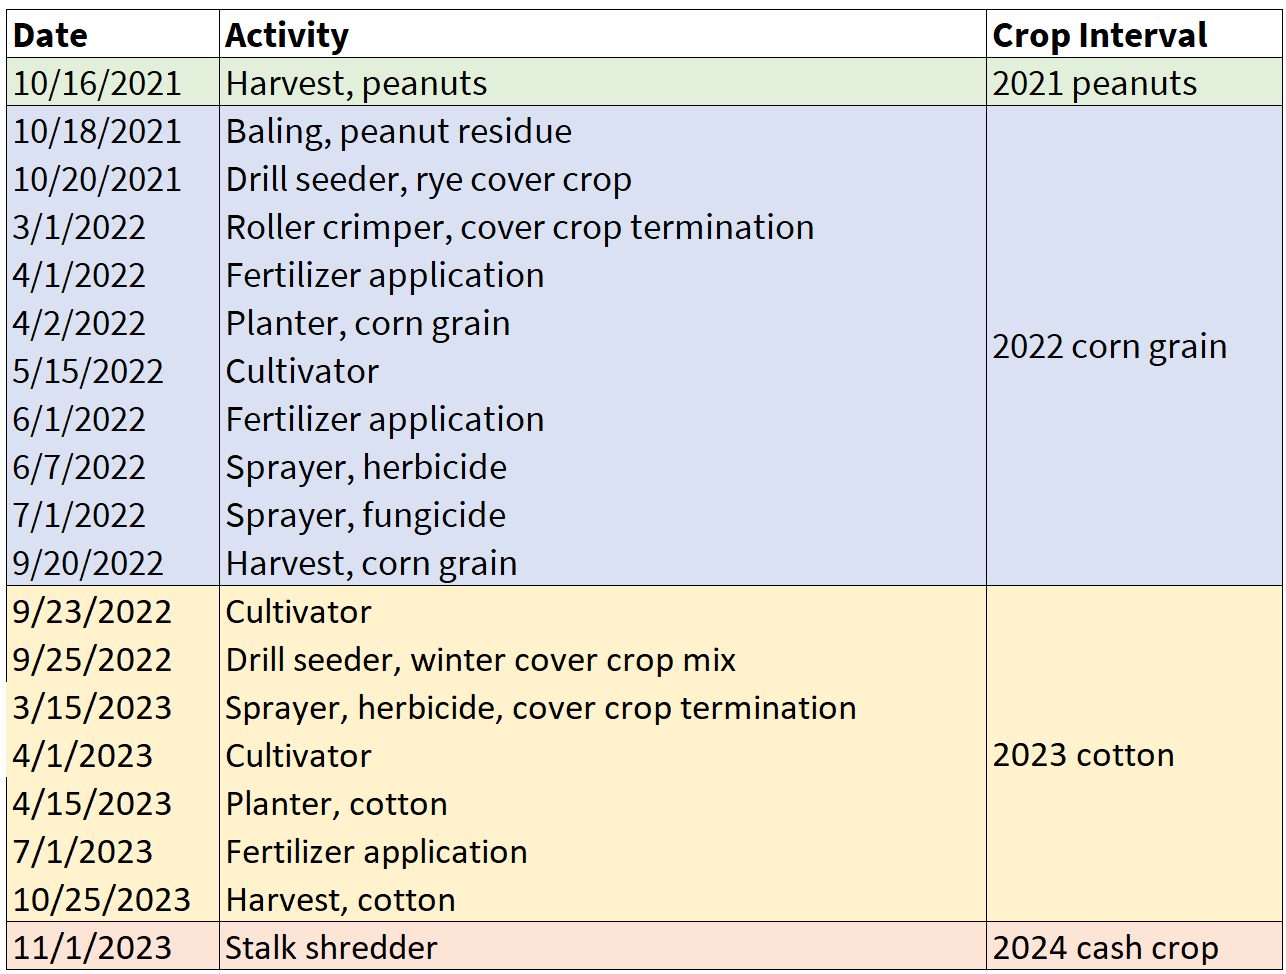
As before, the energy use and GHG emissions associated with the on-farm and field activities are attributed to the crop named in the crop interval. If the cover crop were to be harvested for forage or grain, or if it was consumed by livestock, that would make it a cash crop, and the crop interval would be named and delineated accordingly.
For the crops with complete information shown above, the crop intervals would be delineated as follows:
2022 corn grain: 10/17/2021 to 9/20/2022
2023 cotton: 9/21/2022 to 10/25/2023
Case 4: Fallow years in the rotation
Fallow cropping is common in dryland systems in many regions of the US, including the Great Plains, the Pacific Northwest, and the Rocky Mountain region. Fallow cropping refers to leaving a field unplanted during one or more growing seasons. This is typically done to build up soil water reserves for the following cash crop, among other reasons. Fallow years might have light tillage operations or applications of herbicides to control weeds. The energy use and GHG emissions of those activities, plus any estimated soil N2O emissions or other sources of emissions, are attributed to the following cash crop.
The following figure demonstrates the crop intervals for a rotation with fallow cropping.
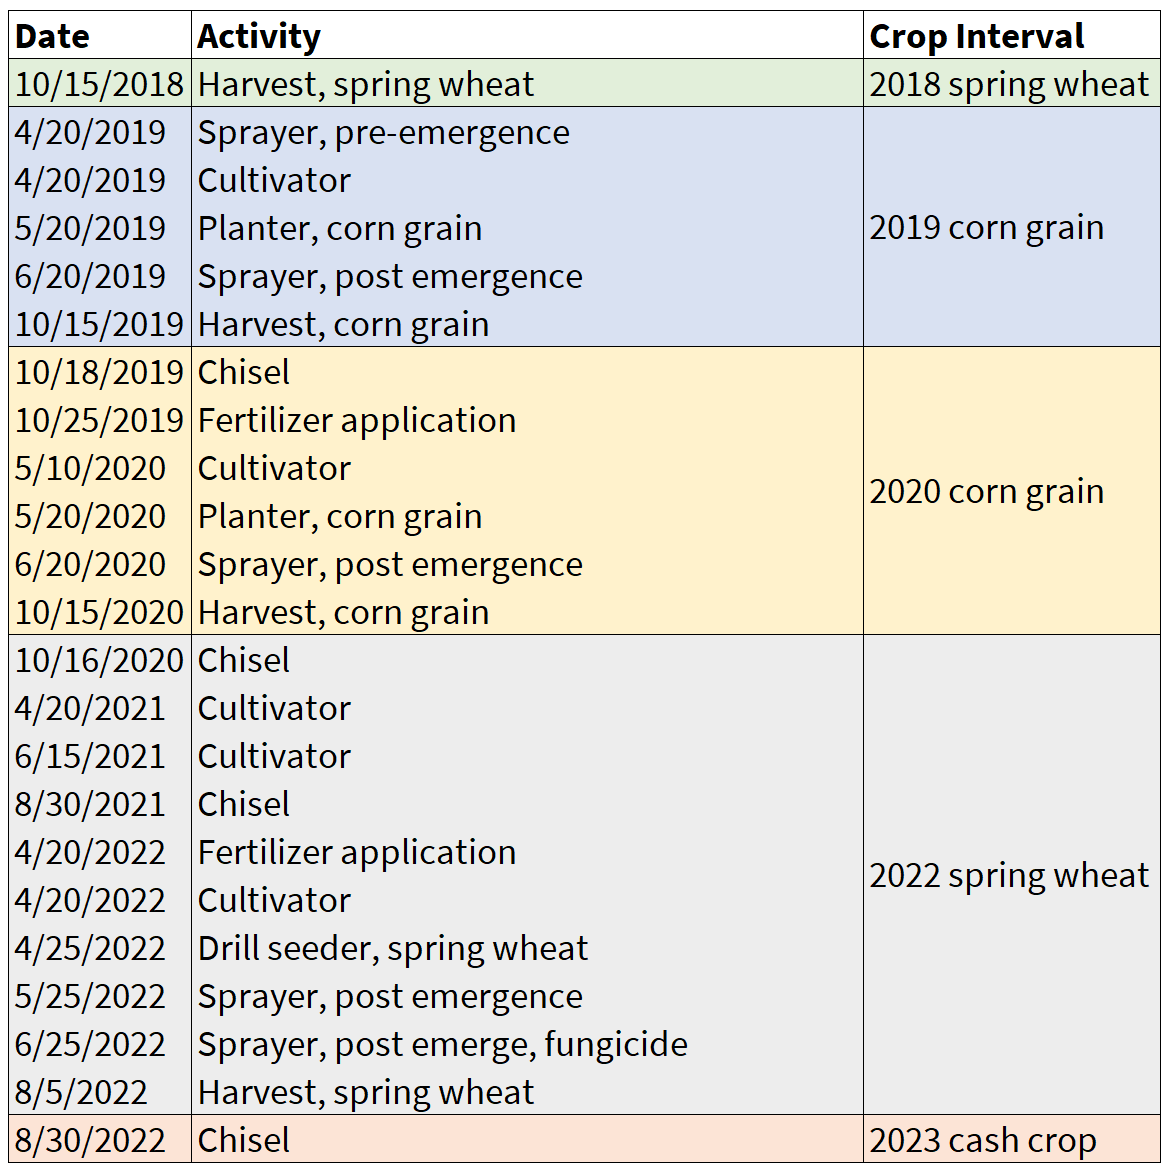
In the example above, 2021 is a fallow year with multiple light tillage passes to control weeds. The 2022 spring wheat crop interval spans two years. For the crops with complete information shown above, the crop intervals would be delineated as follows:
2019 corn grain: 10/16/2018 to 10/15/2019
2020 corn grain: 10/16/2019 to 10/15/2020
2022 spring wheat: 10/16/2020 to 8/5/2022
Case 5: Crop failure or crop abandonment
In the unfortunate case of a crop killed by weather events, such as hail, flood, or drought, the on-farm and field activities for the failed or abandoned crop are assigned to the following cash crop. This is similar to how fallow cropping is treated.
The following figure demonstrates the crop intervals for a rotation with a failed crop.
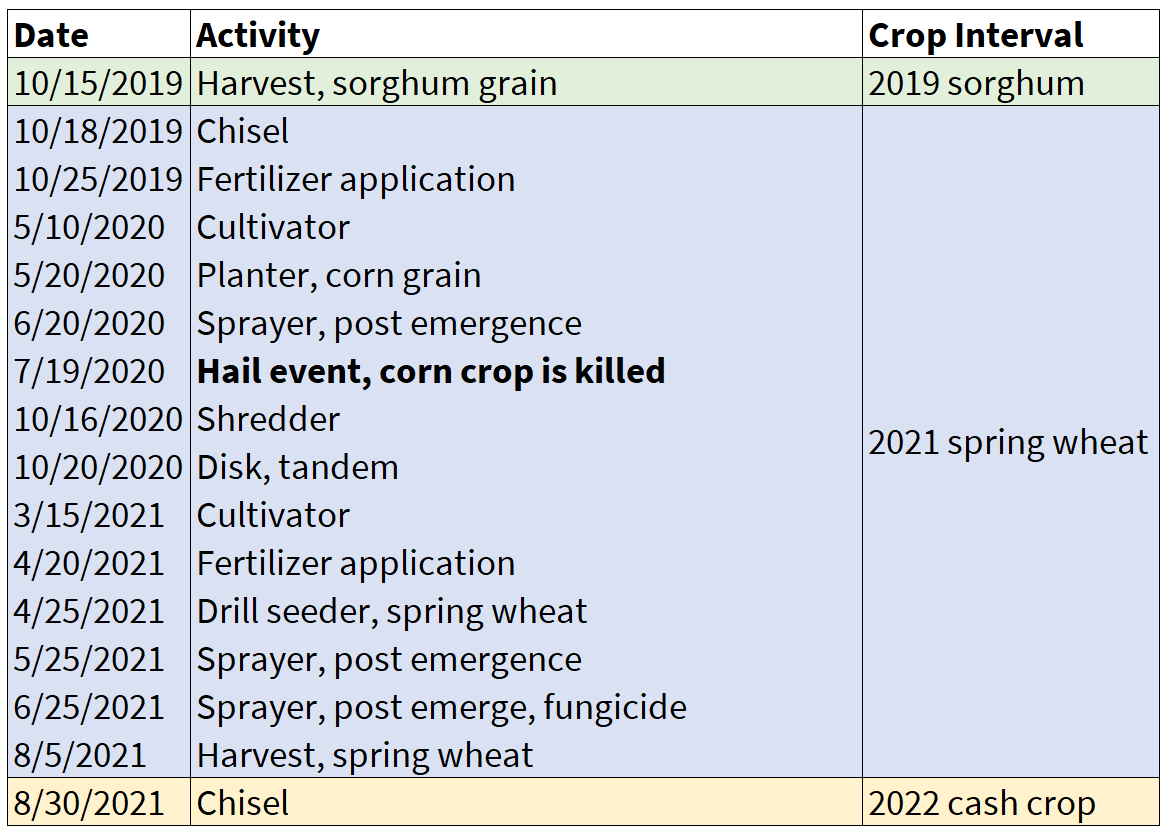
In the example above, the 2020 corn crop suffered a hail event that killed the growing crop (the event is shown in bold font). The grower shredded and incorporated the corn biomass into the soil and returned in the 2021 season to grow spring wheat. The energy use and GHG emissions associated with the failed corn crop are attributed to the 2021 spring wheat.
For the crops with complete information shown above, the crop intervals would be delineated as follows:
- 2021 spring wheat: 10/16/2019 to 8/5/2021
Case 6: Rice crop with ratooning
Rice producers, mostly in Texas and Louisiana, can benefit from rice ratooning: growing a second rice crop from the stubble of the main rice crop, yielding two harvests from the same planted seeds. This presents a unique situation for which there is little guidance for GHG emission accounting methodologies, and it blurs the lines of crop interval delineation. We are faced with three complications:
- The method for CH4 emissions from flooded rice cultivation, as published by Ogle et al. (2024), does not contain guidance about how to account for ratoon emissions.
- Rice ratooning cannot be classified strictly as a double crop because it is harvested from the regrowth of the first rice crop planted at the beginning of the season. It is also not a given that both crops will be managed with the same level of inputs, such as fertilizers.
- The guidance published in IPCC (2019) indicates that the area harvested for the main crop and the ratoon crop should be summed together, which leads to having to sum together the crop production outputs from the two harvests (primary rice crop + ratoon crop).
To solve these challenges, Field to Market proposes using the following approach until better guidance emerges:
- If a field produces annual rice with no ratooning, the method CH4 emissions from flooded rice cultivation is run, and the accounting of energy use and GHG emissions is similar to an annual cash crop described in Section 3.1.
- If a field produces rice with a ratoon crop, the method CH4 emissions from flooded rice cultivation is run aggregating inputs and outputs for both rice crops, and extending the season length from the planting of the first rice crop to the harvest of the ratoon crop (approximately 133 days + 60 days). The estimated energy use and GHG emissions are representative of both crops. This will require filling in some assumptions. Taking this approach will typically result in higher emissions per area (e.g., kg CO2e / ha) and lower emissions per crop production unit (e.g., kg CO2e / kg rice crop) compared to producing a single rice crop per year.
The following figure demonstrates the crop intervals for a rotation with rice ratooning. To be concise, many field activities were omitted from the timeline of operations.
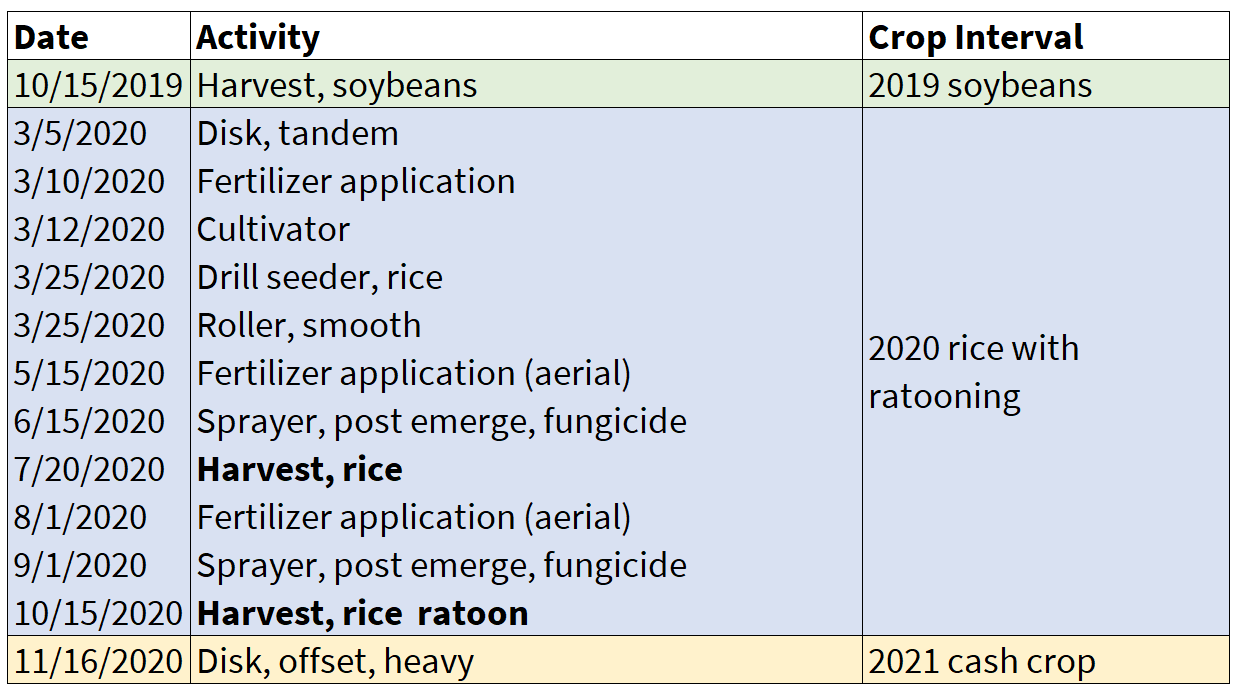
For the crops with complete information shown above, the crop intervals would be delineated as follows:
- 2020 rice with ratooning: 10/16/2019 to 10/15/2020
Case 7: A grower has a rotation with multi-year alfalfa and annual crops
Alfalfa is currently the only perennial crop in Field to Market’s programs. In addition, alfalfa can be harvested multiple times per growing season. The Fieldprint Platform needs the following rules to account for crop intervals for alfalfa:
- The first crop interval for alfalfa will start after the harvest of the last cash crop, and end after the last harvest of the first year with biomass removal. The first crop interval will typically span two years, since the first establishment year is unlikely to include any biomass harvesting.
- For the rest of the alfalfa stand, crop intervals will start after the last harvest in the previous calendar year, and end with the last harvest in the following year. After the first establishment crop interval, all other intervals will accumulate the multiple harvests conducted in a given calendar year.
The following figure demonstrates the crop intervals for a rotation with alfalfa. To be concise, many field activities were omitted from the timeline of operations. Alfalfa was planted in August 2015, and the first harvest occurred in the spring of 2016.
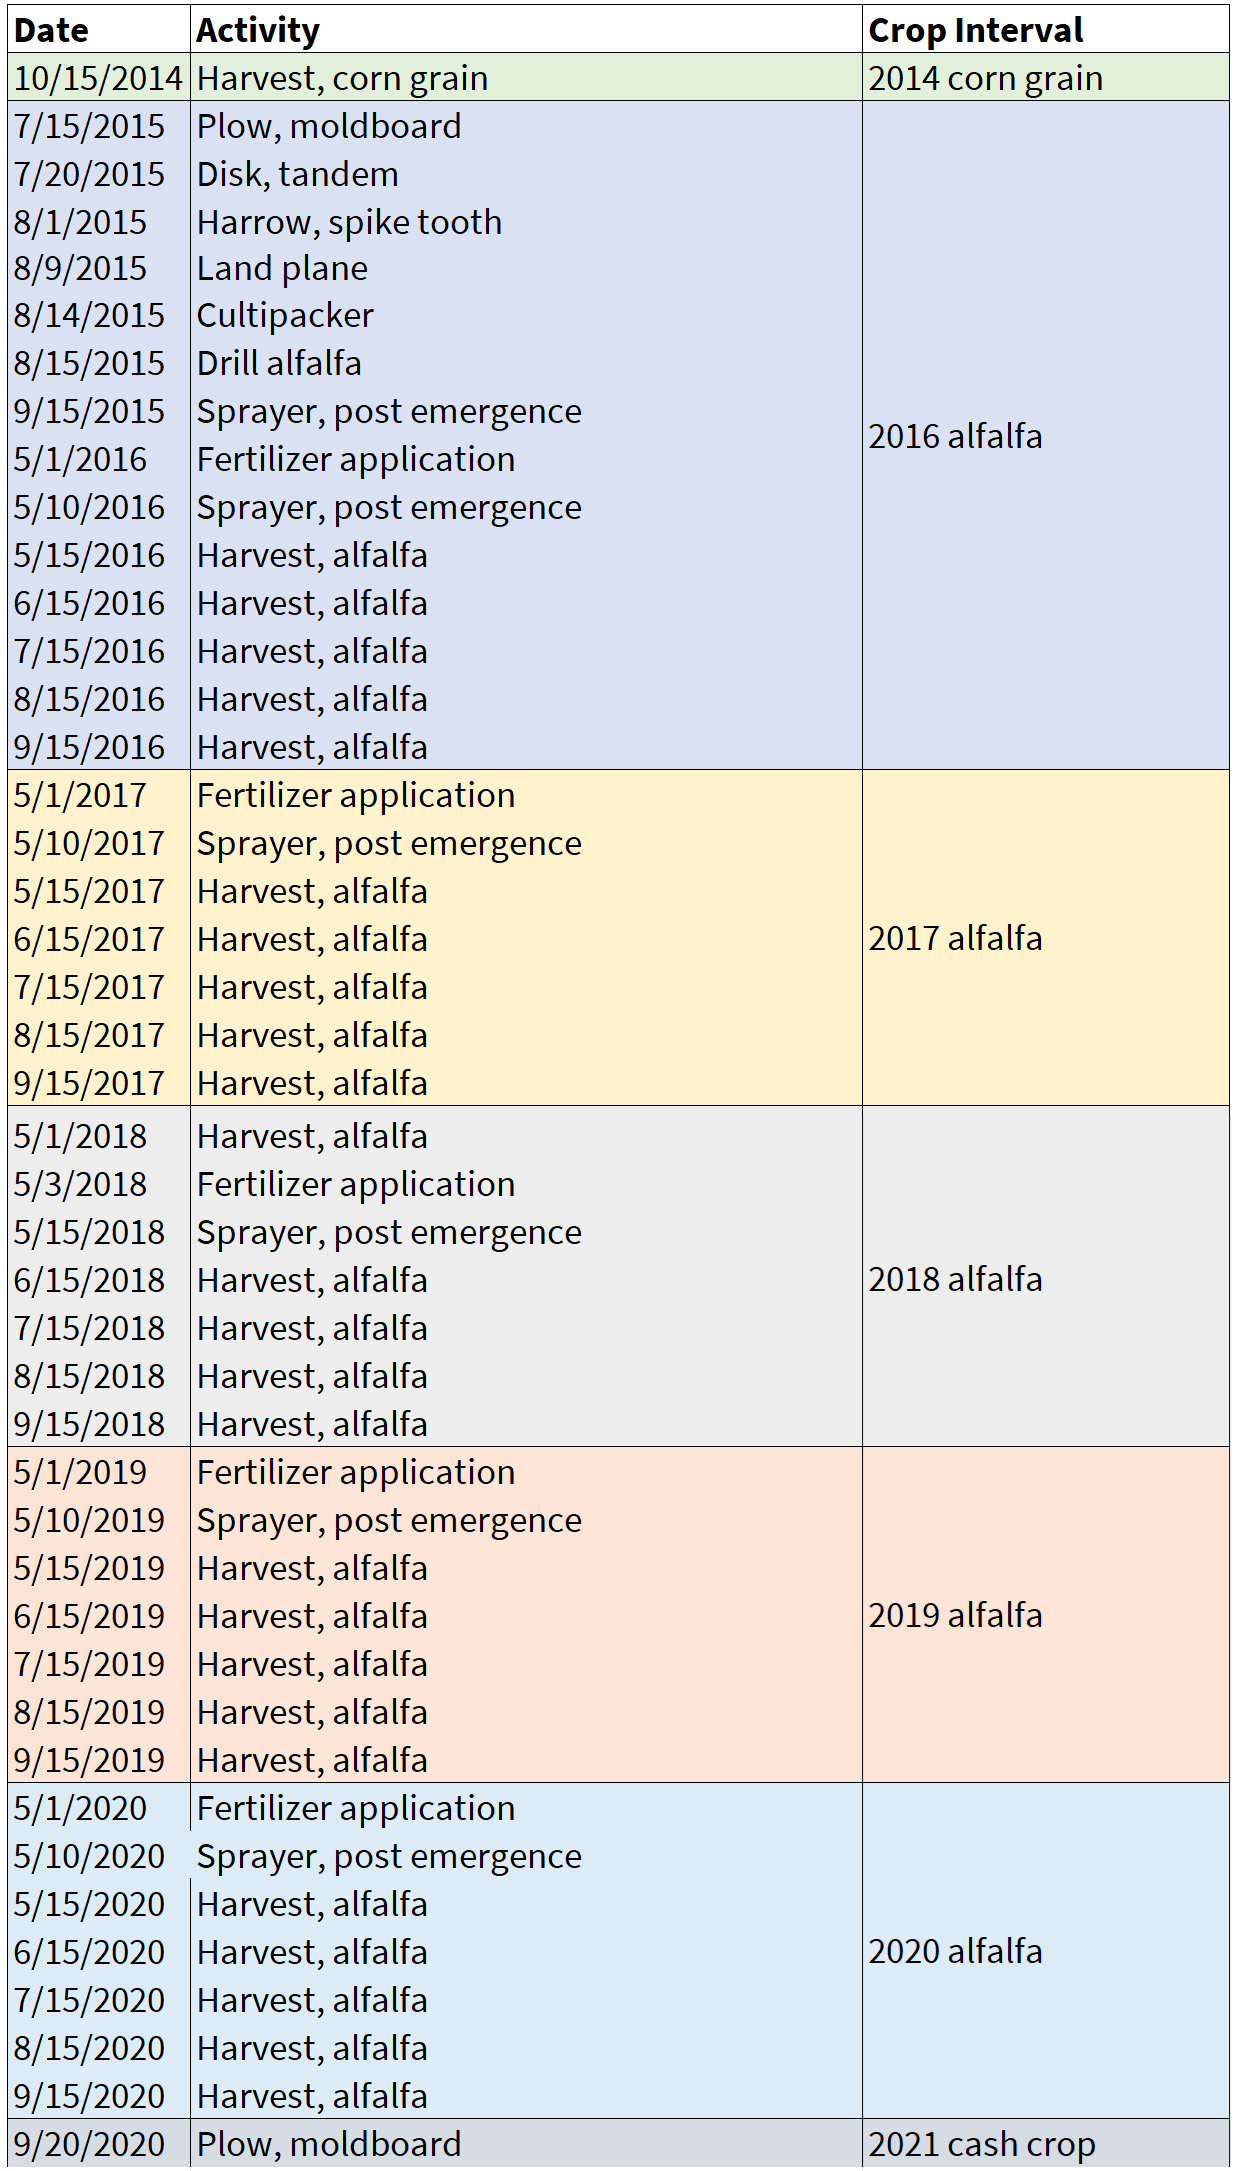
To illustrate the first two crop intervals, the delineation would be as follows:
- 2016 alfalfa: 10/16/2014 to 9/15/2016. This includes the establishment year (2015) and five biomass harvests in 2016.
- 2017 alfalfa: 9/16/2016 to 9/15/2017. This includes five biomass harvests.
Alfalfa crop intervals will continue in the same manner until the crop is terminated, either mechanically with heavy plowing or a mix of tillage and chemical applications. In the example above, the alfalfa stand produced 25 biomass harvests in the span of six years.
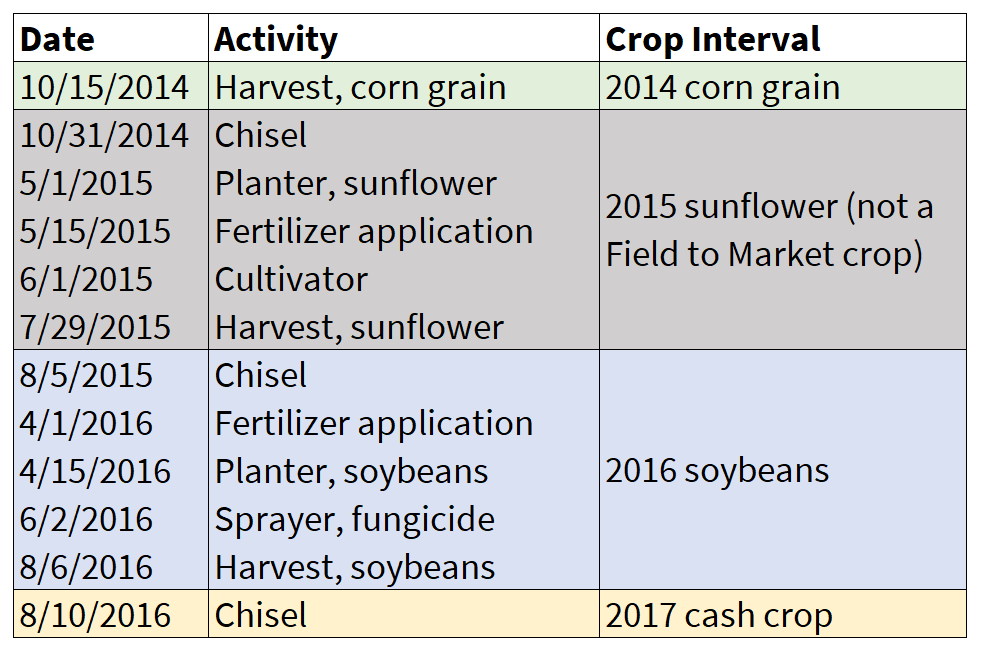
Case 8: Fields with rotations that include crops not part of Field to Market’s program
For FP v5, the system will fill the crop rotation sequence for a given field from 2008 to the latest available year using the Cropland Data Layer (Boryan et al. 2011). This will bring crops that are not yet part of Field to Market’s programs. We will use the crop rotation to model soil carbon stock changes and soil erosion; however, the FP v5 cannot produce output for energy use and GHG emissions for those crop intervals.
The following figure demonstrates a crop interval with a non-FTM crop.
References
Boryan, Claire, Zhengwei Yang, Rick Mueller, and Mike Craig. 2011. “Monitoring US Agriculture: The US Department of Agriculture, National Agricultural Statistics Service, Cropland Data Layer Program.” Geocarto International 26 (5): 341358.
IPCC. 2019. 2019 Refinement to the 2006 IPCC Guidelines for National Greenhouse Gas Inventories.
Kucera, Michael J., and Christopher B. Coreil. 2023. “Overview of USDA-NRCS Erosion Prediction Technology and Conservation Resources - Land Management Operations Database and Use.” Soil Erosion Research Under a Changing Climate, January 8-13, 2023, Aguadilla, Puerto Rico, USA, ahead of print. https://doi.org/10.13031/soil.23007.
Ogle, Stephen M, Paul R Adler, Gary Bentrup, et al. 2024. “Chapter 3: Quantifying Greenhouse Gas Sources and Sinks in Cropland and Grazing Land Systems.” In: Hanson, Wes L.; Itle, Cortney; Edquist, Kara, Eds. Quantifying Greenhouse Gas Fluxes in Agriculture and Forestry: Methods for Entity-Scale Inventory. Technical Bulletin Number 1939, 2nd Edition. Washington, DC: US Department of Agriculture, Office of the Chief Economist. 6-1-6-23. Chapter 3. 1939: 31.